C
Seller's Agent in 2016
Cindy Pease
Pease Real Estate
(815) 325-5163
8 in this area
22 Total Sales
Estimated Value: $88,000 - $113,000
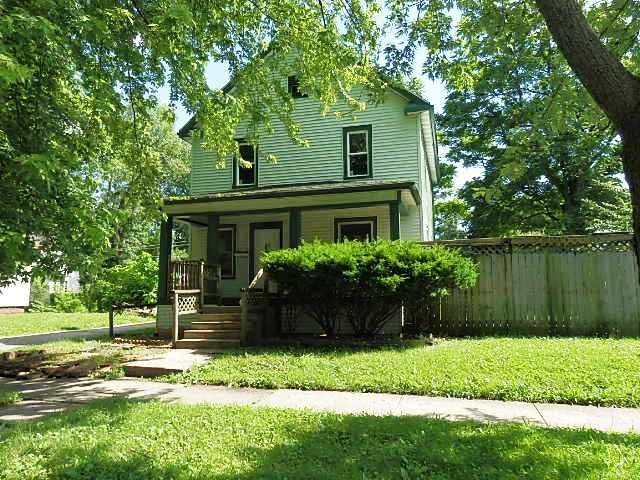
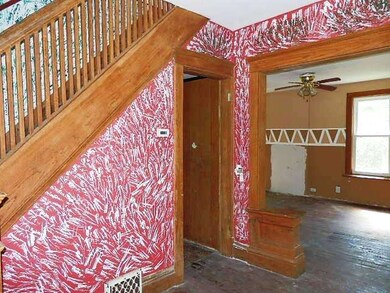
SOLD 'AS IS' SQ FT 1456. PRICE REDUCTION; SEE HOMESTORE FOR DETAILS; LISTED AS " UI".
Last Agent to Sell the Property
Pease Real Estate License #471002131 Listed on: 06/25/2015
| Date | Event | Price | List to Sale | Price per Sq Ft |
|---|---|---|---|---|
| 02/05/2016 02/05/16 | Sold | $10,050 | +0.5% | $7 / Sq Ft |
| 12/28/2015 12/28/15 | Pending | -- | -- | -- |
| 12/24/2015 12/24/15 | Price Changed | $10,000 | -12.3% | $7 / Sq Ft |
| 12/08/2015 12/08/15 | Price Changed | $11,400 | 0.0% | $8 / Sq Ft |
| 12/08/2015 12/08/15 | For Sale | $11,400 | -40.0% | $8 / Sq Ft |
| 11/05/2015 11/05/15 | Pending | -- | -- | -- |
| 10/15/2015 10/15/15 | Price Changed | $19,000 | -20.8% | $13 / Sq Ft |
| 08/27/2015 08/27/15 | Price Changed | $24,000 | -17.2% | $16 / Sq Ft |
| 06/25/2015 06/25/15 | For Sale | $29,000 | -- | $20 / Sq Ft |
| Year | Tax Paid | Tax Assessment Tax Assessment Total Assessment is a certain percentage of the fair market value that is determined by local assessors to be the total taxable value of land and additions on the property. | Land | Improvement |
|---|---|---|---|---|
| 2025 | $2,795 | $26,832 | $4,801 | $22,031 |
| 2024 | $2,795 | $23,641 | $4,230 | $19,411 |
| 2023 | $2,693 | $21,061 | $3,768 | $17,293 |
| 2022 | $2,505 | $18,434 | $3,298 | $15,136 |
| 2021 | $2,364 | $16,683 | $2,985 | $13,698 |
| 2020 | $2,193 | $14,996 | $2,683 | $12,313 |
| 2019 | $2,090 | $13,950 | $2,496 | $11,454 |
| 2018 | $2,013 | $12,917 | $2,311 | $10,606 |
| 2017 | $2,254 | $12,633 | $2,260 | $10,373 |
| 2016 | $2,113 | $12,386 | $2,216 | $10,170 |
| 2015 | $2,041 | $12,639 | $2,261 | $10,378 |
| 2014 | $1,966 | $12,639 | $2,261 | $10,378 |
| 2013 | -- | $13,165 | $2,355 | $10,810 |
C
Seller's Agent in 2016
Cindy Pease
Pease Real Estate
(815) 325-5163
8 in this area
22 Total Sales

Buyer's Agent in 2016
William Sole
Sancken Sole Realty
(815) 252-8456
10 in this area
189 Total Sales
Source: Midwest Real Estate Data (MRED)
MLS Number: MRD08964684
APN: 16-17-04-300-002
Disclaimer: Certain information contained herein is derived from information provided by parties other than Homes.com. All information provided is deemed reliable, but is not guaranteed to be accurate and should be independently verified.
![]() Based on information submitted to the MLS GRID. All data is obtained from various sources and may not have been verified by broker or MLS GRID. Supplied Open House Information is subject to change without notice. All information should be independently reviewed and verified for accuracy. Properties may or may not be listed by the office/agent presenting the information. Some IDX listings have been excluded from this website.
Based on information submitted to the MLS GRID. All data is obtained from various sources and may not have been verified by broker or MLS GRID. Supplied Open House Information is subject to change without notice. All information should be independently reviewed and verified for accuracy. Properties may or may not be listed by the office/agent presenting the information. Some IDX listings have been excluded from this website.
Based on information submitted to the MLS GRID
Ask me questions while you tour the home.