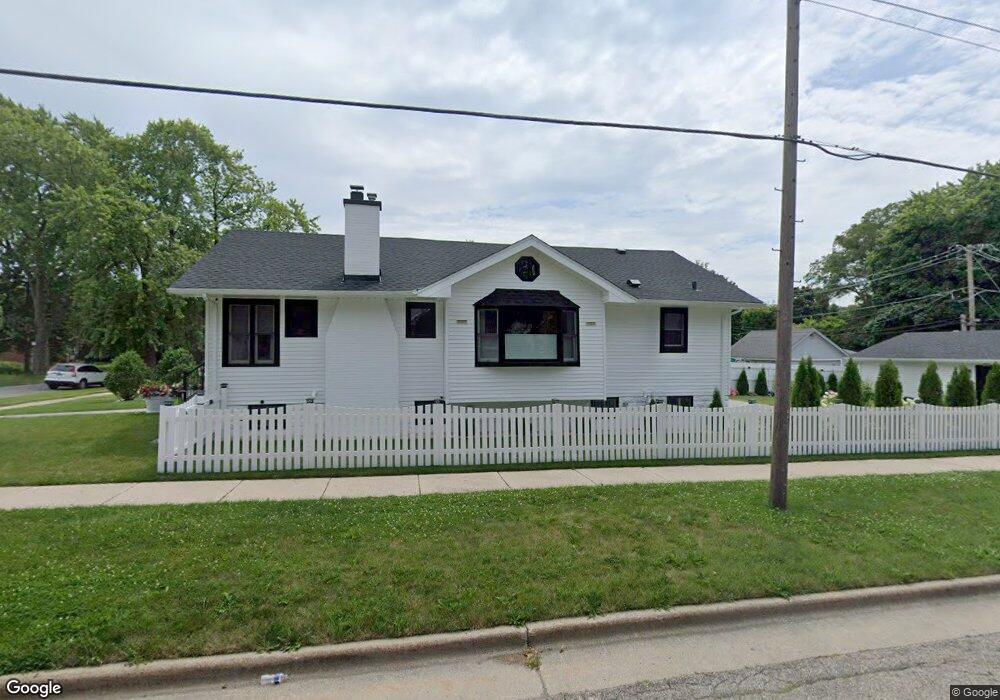
1344 N Ash St Waukegan, IL 60085
Estimated Value: $253,459 - $300,000
3
Beds
1
Bath
1,344
Sq Ft
$204/Sq Ft
Est. Value
About This Home
This home is located at 1344 N Ash St, Waukegan, IL 60085 and is currently estimated at $274,115, approximately $203 per square foot. 1344 N Ash St is a home located in Lake County with nearby schools including Glen Flora Elementary School, Edith M Smith Middle School, and Waukegan High School.
Ownership History
Date
Name
Owned For
Owner Type
Purchase Details
Closed on
Jul 27, 2021
Sold by
Fuente Darlene L
Bought by
Garcia Emilio Alanis and Garcia Diana Soto
Current Estimated Value
Purchase Details
Closed on
Aug 13, 1997
Sold by
Fuente Daniel M
Bought by
Fuente Darlene L
Purchase Details
Closed on
Sep 1, 1995
Sold by
Mittelberg Victor
Bought by
Fuente Daniel M and Fuente Darlne M
Home Financials for this Owner
Home Financials are based on the most recent Mortgage that was taken out on this home.
Original Mortgage
$70,200
Interest Rate
7.76%
Purchase Details
Closed on
Aug 8, 1995
Sold by
Schuett Jeffrey G and Martins James B
Bought by
Mittleberg Victor
Home Financials for this Owner
Home Financials are based on the most recent Mortgage that was taken out on this home.
Original Mortgage
$70,200
Interest Rate
7.76%
Create a Home Valuation Report for This Property
The Home Valuation Report is an in-depth analysis detailing your home's value as well as a comparison with similar homes in the area
Home Values in the Area
Average Home Value in this Area
Purchase History
| Date | Buyer | Sale Price | Title Company |
|---|---|---|---|
| Garcia Emilio Alanis | $180,000 | Chicago Title | |
| Fuente Darlene L | -- | -- | |
| Fuente Daniel M | $74,000 | -- | |
| Mittleberg Victor | $58,000 | Chicago Title Insurance Co |
Source: Public Records
Mortgage History
| Date | Status | Borrower | Loan Amount |
|---|---|---|---|
| Previous Owner | Fuente Daniel M | $70,200 |
Source: Public Records
Tax History Compared to Growth
Tax History
| Year | Tax Paid | Tax Assessment Tax Assessment Total Assessment is a certain percentage of the fair market value that is determined by local assessors to be the total taxable value of land and additions on the property. | Land | Improvement |
|---|---|---|---|---|
| 2024 | $4,995 | $67,607 | $10,551 | $57,056 |
| 2023 | $4,892 | $60,972 | $9,515 | $51,457 |
| 2022 | $4,892 | $56,045 | $8,273 | $47,772 |
| 2021 | $4,192 | $46,209 | $7,380 | $38,829 |
| 2020 | $4,200 | $43,049 | $6,875 | $36,174 |
| 2019 | $4,174 | $39,448 | $6,300 | $33,148 |
| 2018 | $3,956 | $35,807 | $8,917 | $26,890 |
| 2017 | $3,653 | $31,679 | $7,889 | $23,790 |
| 2016 | $3,327 | $27,528 | $6,855 | $20,673 |
| 2015 | $3,148 | $24,638 | $6,135 | $18,503 |
| 2014 | $4,032 | $29,370 | $5,705 | $23,665 |
| 2012 | $3,985 | $31,819 | $6,181 | $25,638 |
Source: Public Records
Map
Nearby Homes
- 1336 N Ash St
- 1335 Chestnut St
- 1110 N Ash St
- 616 W Keith Ave
- 1312 N Linden Ave
- 1018 W Atlantic Ave
- 1105 Woodlawn Cir
- 918 N Ash St
- 415 W Ridgeland Ave
- 917 N Linden Ave
- 1000 Pine St
- 1504 W Glen Flora Ave
- 1109 Massena Ave
- 1905 Linden Ave
- 1117 Judge Ave
- 620 N Poplar St
- 824 N Butrick St
- 723 N County St
- 702 Franklin St
- 325 4th St
- 1342 N Ash St
- 717 W Grove Ave
- 1334 N Ash St
- 708 W Grove Ave
- 706 W Grove Ave
- 725 W Grove Ave
- 1332 N Ash St
- 710 W Grove Ave
- 1343 Chestnut St
- 702 W Grove Ave
- 716 W Grove Ave
- 630 W Grove Ave
- 1341 N Ash St
- 1339 N Ash St
- 720 W Grove Ave
- 1331 Chestnut St
- 1335 N Ash St
- 1326 N Ash St
- 1331 N Ash St Unit 2
- 1331 N Ash St Unit 1