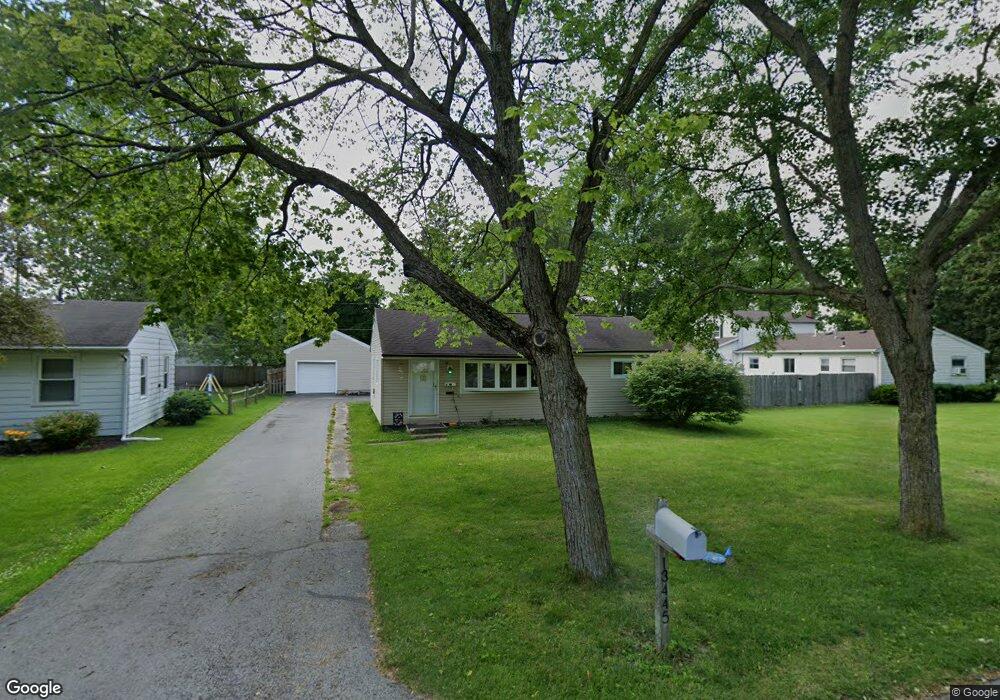
13445 Ash St Weston, OH 43569
Estimated Value: $144,000 - $156,000
2
Beds
1
Bath
1,040
Sq Ft
$142/Sq Ft
Est. Value
About This Home
This home is located at 13445 Ash St, Weston, OH 43569 and is currently estimated at $147,998, approximately $142 per square foot. 13445 Ash St is a home located in Wood County with nearby schools including Otsego Elementary School, Otsego Junior High School, and Otsego High School.
Ownership History
Date
Name
Owned For
Owner Type
Purchase Details
Closed on
Jun 15, 2012
Sold by
Boyer Barbara S
Bought by
Ball Lindsey A
Current Estimated Value
Purchase Details
Closed on
Sep 20, 2010
Sold by
Ball Lindsey A and Ball Randolph B
Bought by
Ball Lindsey A and Boyer Barbara S
Home Financials for this Owner
Home Financials are based on the most recent Mortgage that was taken out on this home.
Original Mortgage
$76,176
Interest Rate
4.62%
Mortgage Type
FHA
Purchase Details
Closed on
Nov 13, 2008
Sold by
Ybanes Raynaldo G and Ybanes Juanita T
Bought by
Boyer Lindsey A
Home Financials for this Owner
Home Financials are based on the most recent Mortgage that was taken out on this home.
Original Mortgage
$74,023
Interest Rate
6.09%
Mortgage Type
FHA
Purchase Details
Closed on
Jun 13, 1977
Bought by
Ybanes Raynaldo G
Create a Home Valuation Report for This Property
The Home Valuation Report is an in-depth analysis detailing your home's value as well as a comparison with similar homes in the area
Home Values in the Area
Average Home Value in this Area
Purchase History
| Date | Buyer | Sale Price | Title Company |
|---|---|---|---|
| Ball Lindsey A | -- | None Available | |
| Ball Lindsey A | -- | Attorney | |
| Boyer Lindsey A | $75,000 | Attorney | |
| Ybanes Raynaldo G | $32,900 | -- |
Source: Public Records
Mortgage History
| Date | Status | Borrower | Loan Amount |
|---|---|---|---|
| Previous Owner | Ball Lindsey A | $76,176 | |
| Previous Owner | Boyer Lindsey A | $74,023 |
Source: Public Records
Tax History Compared to Growth
Tax History
| Year | Tax Paid | Tax Assessment Tax Assessment Total Assessment is a certain percentage of the fair market value that is determined by local assessors to be the total taxable value of land and additions on the property. | Land | Improvement |
|---|---|---|---|---|
| 2024 | $1,558 | $36,715 | $4,025 | $32,690 |
| 2023 | $1,558 | $36,720 | $4,030 | $32,690 |
| 2021 | $1,384 | $29,580 | $4,030 | $25,550 |
| 2020 | $1,392 | $29,580 | $4,030 | $25,550 |
| 2019 | $1,277 | $26,120 | $4,030 | $22,090 |
| 2018 | $1,239 | $26,120 | $4,030 | $22,090 |
| 2017 | $1,211 | $26,120 | $4,030 | $22,090 |
| 2016 | $1,107 | $24,470 | $4,030 | $20,440 |
| 2015 | $1,107 | $24,470 | $4,030 | $20,440 |
| 2014 | $1,140 | $24,470 | $4,030 | $20,440 |
| 2013 | $1,246 | $24,470 | $4,030 | $20,440 |
Source: Public Records
Map
Nearby Homes
- 20391 Brown Ln
- 20410 Oak St
- 20390 Locust St
- 20525 Locust St
- 20340 Locust St
- 0 Otsego Pike Unit 6136991
- 15255 Van Tassel Rd
- 19393 U S 6
- 22327 U S 6
- 17884 Euler Rd
- 22888 Wintergreen Rd
- 16710 Potter Rd
- 19330 Tuller Rd
- 0 Kellogg Rd Unit 6125521
- 0 Potter Rd Unit 6135109
- 9097 Custar Rd
- 22767 Defiance Pike
- 22856 Main St
- 17630 Woodburn Ave
- 16920 Long Judson Rd