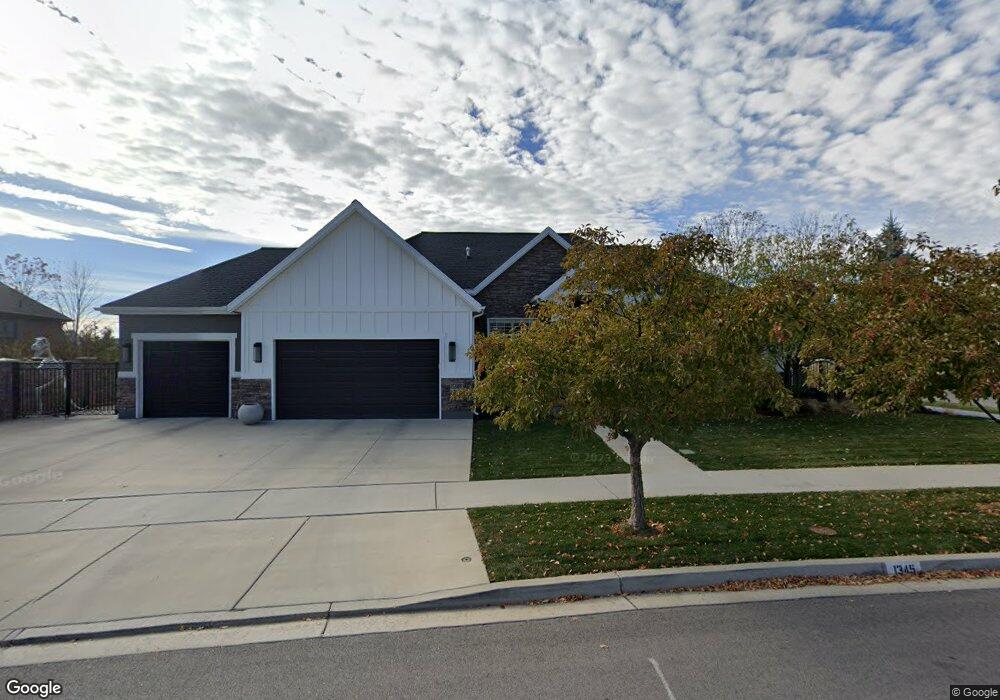
1345 Daniel Dr Orem, UT 84057
Windsor NeighborhoodEstimated Value: $639,000 - $743,335
3
Beds
2
Baths
3,819
Sq Ft
$176/Sq Ft
Est. Value
About This Home
This home is located at 1345 Daniel Dr, Orem, UT 84057 and is currently estimated at $671,334, approximately $175 per square foot. 1345 Daniel Dr is a home located in Utah County with nearby schools including Windsor School, Canyon View Junior High School, and Timpanogos High School.
Ownership History
Date
Name
Owned For
Owner Type
Purchase Details
Closed on
Aug 10, 2020
Sold by
Magleby Cathy L and Cathy Le Magleby Family Trust
Bought by
Ross Lindsay and Ross Robert B
Current Estimated Value
Home Financials for this Owner
Home Financials are based on the most recent Mortgage that was taken out on this home.
Original Mortgage
$503,500
Outstanding Balance
$447,465
Interest Rate
3.1%
Mortgage Type
New Conventional
Estimated Equity
$223,869
Purchase Details
Closed on
Mar 16, 2015
Sold by
Magleby Paul M
Bought by
Magleby Cathy L and Cathy Lee Magleby Family Trust
Purchase Details
Closed on
Jun 4, 2014
Sold by
Millhaven Construction Llc
Bought by
Magleby Paul M
Home Financials for this Owner
Home Financials are based on the most recent Mortgage that was taken out on this home.
Original Mortgage
$313,100
Interest Rate
4.27%
Mortgage Type
New Conventional
Create a Home Valuation Report for This Property
The Home Valuation Report is an in-depth analysis detailing your home's value as well as a comparison with similar homes in the area
Home Values in the Area
Average Home Value in this Area
Purchase History
| Date | Buyer | Sale Price | Title Company |
|---|---|---|---|
| Ross Lindsay | -- | Bartlett Title Ins Agcy Inc | |
| Magleby Cathy L | -- | Bartlett Title Ins Agen | |
| Magleby Paul M | -- | Union Title |
Source: Public Records
Mortgage History
| Date | Status | Borrower | Loan Amount |
|---|---|---|---|
| Open | Ross Lindsay | $503,500 | |
| Previous Owner | Magleby Paul M | $313,100 |
Source: Public Records
Tax History
| Year | Tax Paid | Tax Assessment Tax Assessment Total Assessment is a certain percentage of the fair market value that is determined by local assessors to be the total taxable value of land and additions on the property. | Land | Improvement |
|---|---|---|---|---|
| 2025 | $5,058 | $668,300 | $264,000 | $404,300 |
| 2024 | $5,058 | $618,500 | $0 | $0 |
| 2023 | $4,753 | $624,700 | $0 | $0 |
| 2022 | $5,309 | $675,900 | $268,000 | $407,900 |
| 2021 | $4,809 | $510,100 | $191,400 | $318,700 |
| 2020 | $4,508 | $469,900 | $166,400 | $303,500 |
| 2019 | $3,978 | $431,200 | $166,400 | $264,800 |
| 2018 | $4,163 | $431,200 | $166,400 | $264,800 |
| 2017 | $3,932 | $396,700 | $0 | $0 |
| 2016 | $4,066 | $378,200 | $0 | $0 |
| 2015 | $2,271 | $199,815 | $0 | $0 |
| 2014 | $1,754 | $153,560 | $0 | $0 |
Source: Public Records
Map
Nearby Homes
- 287 W 1380 N
- 332 W Amiron Way Unit D
- 1461 N Amiron Way Unit B
- 1548 N 275 West St Unit 2
- 512 W 1450 N
- 1566 N 275 West St Unit 1
- 527 W 1450 N
- 1547 N 275 West St Unit 5
- 1545 N State St Unit 1
- 582 W 1300 N
- 1244 N 580 W
- 538 W 1120 N
- 1230 N 685 W
- 1744 N 280 W
- 1552 N 740 W
- 1405 N 770 W
- 125 W 870 N
- 1123 N 800 W
- 645 W 920 N
- 49 W 1880 N
Your Personal Tour Guide
Ask me questions while you tour the home.