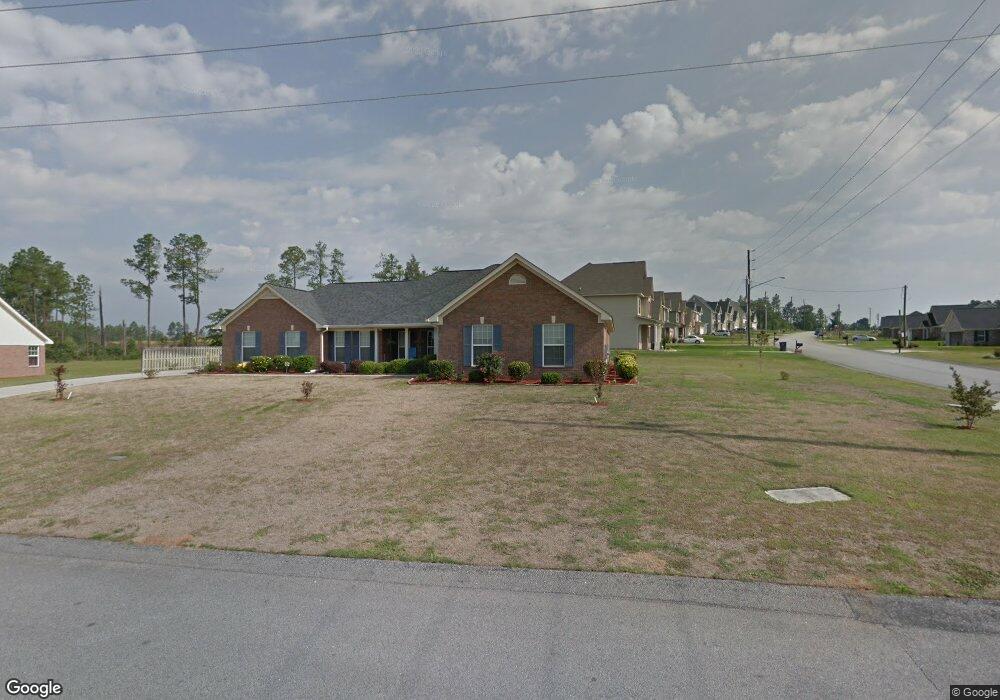
1345 Walton Loop Hephzibah, GA 30815
Jamestown NeighborhoodEstimated Value: $302,000 - $356,000
4
Beds
3
Baths
2,350
Sq Ft
$136/Sq Ft
Est. Value
About This Home
This home is located at 1345 Walton Loop, Hephzibah, GA 30815 and is currently estimated at $320,411, approximately $136 per square foot. 1345 Walton Loop is a home located in Richmond County with nearby schools including Deer Chase Elementary School, Hephzibah Middle School, and Johnson Magnet.
Ownership History
Date
Name
Owned For
Owner Type
Purchase Details
Closed on
Jul 11, 2008
Sold by
Nathan Youngblood Homebuilders Inc
Bought by
Crawford John
Current Estimated Value
Home Financials for this Owner
Home Financials are based on the most recent Mortgage that was taken out on this home.
Original Mortgage
$209,900
Outstanding Balance
$134,554
Interest Rate
6.03%
Mortgage Type
VA
Estimated Equity
$185,857
Purchase Details
Closed on
Feb 29, 2008
Sold by
Youngblood Nathan
Bought by
Nathan Youngblood Homebuilders Inc
Purchase Details
Closed on
Feb 12, 2008
Sold by
Southern Specialty Development Co Inc
Bought by
Youngblood Nathan
Create a Home Valuation Report for This Property
The Home Valuation Report is an in-depth analysis detailing your home's value as well as a comparison with similar homes in the area
Home Values in the Area
Average Home Value in this Area
Purchase History
| Date | Buyer | Sale Price | Title Company |
|---|---|---|---|
| Crawford John | $209,900 | None Available | |
| Nathan Youngblood Homebuilders Inc | -- | None Available | |
| Youngblood Nathan | $74,700 | None Available |
Source: Public Records
Mortgage History
| Date | Status | Borrower | Loan Amount |
|---|---|---|---|
| Open | Crawford John | $209,900 |
Source: Public Records
Tax History Compared to Growth
Tax History
| Year | Tax Paid | Tax Assessment Tax Assessment Total Assessment is a certain percentage of the fair market value that is determined by local assessors to be the total taxable value of land and additions on the property. | Land | Improvement |
|---|---|---|---|---|
| 2025 | $470 | $117,024 | $12,400 | $104,624 |
| 2024 | $470 | $109,692 | $12,400 | $97,292 |
| 2023 | $406 | $101,700 | $12,400 | $89,300 |
| 2022 | $396 | $97,149 | $12,400 | $84,749 |
| 2021 | $396 | $69,400 | $12,400 | $57,000 |
| 2020 | $396 | $69,400 | $12,400 | $57,000 |
| 2019 | $396 | $69,400 | $12,400 | $57,000 |
| 2018 | $396 | $69,400 | $12,400 | $57,000 |
| 2017 | $389 | $69,400 | $12,400 | $57,000 |
| 2016 | $389 | $69,400 | $12,400 | $57,000 |
| 2015 | $393 | $69,400 | $12,400 | $57,000 |
| 2014 | $396 | $68,982 | $12,400 | $56,582 |
Source: Public Records
Map
Nearby Homes
- 1764 Deer Chase Ln
- 1708 Ethan Way
- 1432 Issac Way
- 2640 Carrington Dr
- 1855 Beaver Creek Ln
- 1610 Jonathan Place
- 2160 Kaneck Way
- 2213 Riley Ct
- 2614 Sadie Ct
- 2003 Jocelyn Place
- 1914 Mitchell Place
- 4358 Creekview Dr
- 2682 Inverness Dr
- 2686 Inverness Dr
- 2690 Inverness Dr
- 2698 Inverness Dr
- 2705 Inverness Dr
- 2706 Inverness Dr
- 2709 Inverness Dr
- 2710 Inverness Dr
- 1760 Deer Chase Ln
- 1762 Deer Chase Ln
- 1349 Walton Loop
- 1761 Deer Chase Ln
- 1346 Walton Loop
- 1759 Deer Chase Ln
- 1763 Deer Chase Ln
- 1351 Walton Loop
- 1766 Deer Chase Ln
- 1757 Deer Chase Ln
- 1765 Deer Chase Ln
- 1754 Deer Chase Ln
- 1353 Walton Loop
- 1767 Deer Chase Ln
- 1350 Walton Loop
- 1755 Deer Chase Ln
- 1768 Deer Chase Ln
- 1803 Owen Way
- 1805 Owen Way
- 1805 Mickie Ann Way