S
Seller's Agent in 2013
Susan Gant
RE/MAX

Estimated Value: $190,824 - $245,000
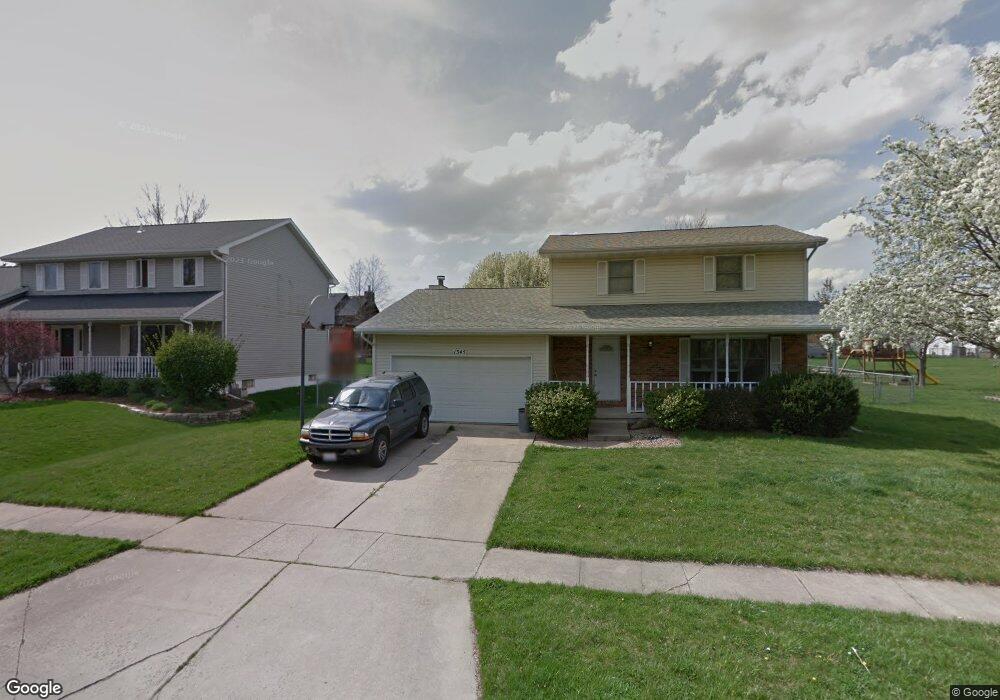
Great buy in Mt Zion.! Needs some TLC but a lot of house here, for the handyman! Needs drywall repair, carpeting and appliance replacementr. Nice floor plan with deck off dining area and another off of family room. Lots of built in cabinets in the family room too! Yard is large and fenced in. Nice porch across front of home.Currently assessed at $144,804. Seller is selling as is, NEEDS SOLD!
Last Agent to Sell the Property
Susan Gant
RE/MAX Executives Plus License #475138191 Listed on: 05/30/2013
| Date | Buyer | Sale Price | Title Company |
|---|---|---|---|
| Fritzsche Joseph T | $142,000 | None Available | |
| Davis Kenneth E | $85,000 | None Available | |
| -- | $85,000 | -- |
| Date | Status | Borrower | Loan Amount |
|---|---|---|---|
| Open | Fritzsche Joseph T | $113,600 | |
| Previous Owner | Davis Kenneth E | $68,000 |
| Date | Event | Price | List to Sale | Price per Sq Ft |
|---|---|---|---|---|
| 09/06/2013 09/06/13 | Sold | $85,000 | -25.8% | $50 / Sq Ft |
| 08/18/2013 08/18/13 | Pending | -- | -- | -- |
| 05/30/2013 05/30/13 | For Sale | $114,500 | -- | $67 / Sq Ft |
| Year | Tax Paid | Tax Assessment Tax Assessment Total Assessment is a certain percentage of the fair market value that is determined by local assessors to be the total taxable value of land and additions on the property. | Land | Improvement |
|---|---|---|---|---|
| 2024 | $4,002 | $57,274 | $6,050 | $51,224 |
| 2023 | $3,860 | $53,268 | $5,627 | $47,641 |
| 2022 | $3,684 | $50,525 | $5,338 | $45,187 |
| 2021 | $3,566 | $47,333 | $5,000 | $42,333 |
| 2020 | $2,629 | $30,831 | $5,708 | $25,123 |
| 2019 | $2,629 | $30,831 | $5,708 | $25,123 |
| 2018 | $2,556 | $30,044 | $5,562 | $24,482 |
| 2017 | $2,526 | $29,466 | $5,455 | $24,011 |
| 2016 | $2,505 | $28,953 | $5,360 | $23,593 |
| 2015 | $2,426 | $28,666 | $5,307 | $23,359 |
| 2014 | $2,338 | $28,666 | $5,307 | $23,359 |
| 2013 | -- | $28,666 | $5,307 | $23,359 |
S
Seller's Agent in 2013
Susan Gant
RE/MAX

Buyer's Agent in 2013
Paula Cooley
Beck Realtors, Inc.
(217) 454-1050
2 in this area
11 Total Sales
Source: Central Illinois Board of REALTORS®
MLS Number: 5191383
APN: 12-17-04-108-018
Ask me questions while you tour the home.