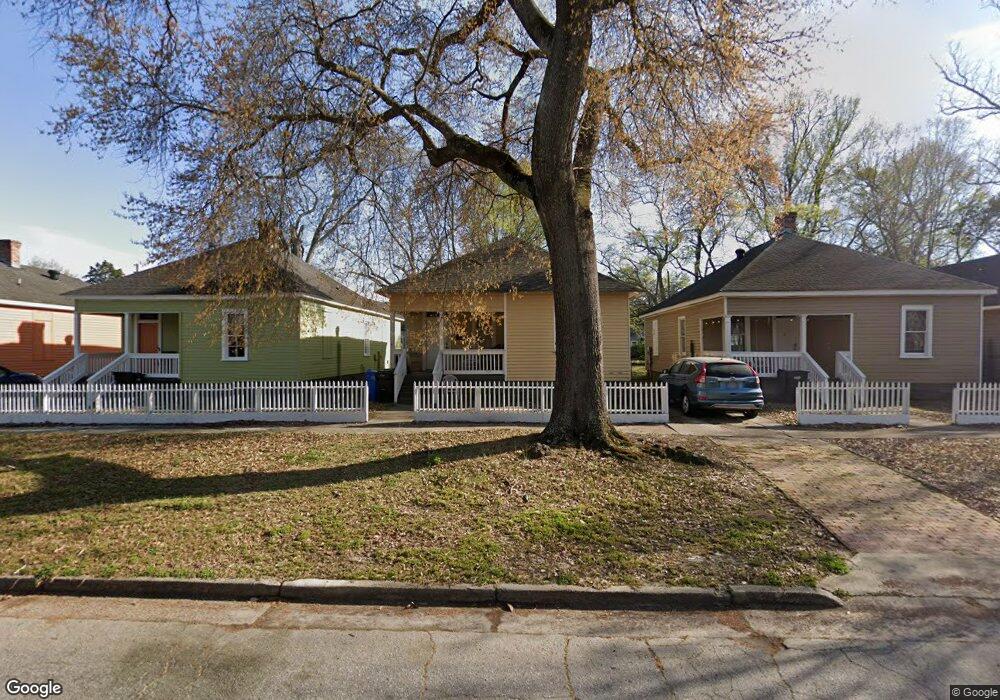
1346 & 1344 21st St Columbus, GA 31901
East Highlands NeighborhoodEstimated Value: $135,000 - $225,349
4
Beds
4
Baths
2,100
Sq Ft
$80/Sq Ft
Est. Value
About This Home
This home is located at 1346 & 1344 21st St, Columbus, GA 31901 and is currently estimated at $168,450, approximately $80 per square foot. 1346 & 1344 21st St is a home located in Muscogee County with nearby schools including Arnold Middle School, Jordan Vocational High School, and Wynnton Elementary School.
Ownership History
Date
Name
Owned For
Owner Type
Purchase Details
Closed on
Mar 21, 2025
Sold by
Bussey Development Llc
Bought by
5Pm Llc
Current Estimated Value
Home Financials for this Owner
Home Financials are based on the most recent Mortgage that was taken out on this home.
Original Mortgage
$1,102,728
Outstanding Balance
$934,355
Interest Rate
6.89%
Mortgage Type
New Conventional
Estimated Equity
-$765,905
Purchase Details
Closed on
Mar 2, 2025
Sold by
Bussey Larry W
Bought by
Bussey Development Llc
Home Financials for this Owner
Home Financials are based on the most recent Mortgage that was taken out on this home.
Original Mortgage
$1,102,728
Outstanding Balance
$934,355
Interest Rate
6.89%
Mortgage Type
New Conventional
Estimated Equity
-$765,905
Purchase Details
Closed on
Dec 30, 2021
Sold by
Bussey Larry W
Bought by
Bussey Development Llc
Create a Home Valuation Report for This Property
The Home Valuation Report is an in-depth analysis detailing your home's value as well as a comparison with similar homes in the area
Home Values in the Area
Average Home Value in this Area
Purchase History
| Date | Buyer | Sale Price | Title Company |
|---|---|---|---|
| 5Pm Llc | $1,100,000 | None Listed On Document | |
| 5Pm Llc | $1,100,000 | None Listed On Document | |
| Bussey Development Llc | -- | None Listed On Document | |
| Bussey Development Llc | $643,800 | None Listed On Document |
Source: Public Records
Mortgage History
| Date | Status | Borrower | Loan Amount |
|---|---|---|---|
| Open | 5Pm Llc | $1,102,728 | |
| Closed | 5Pm Llc | $1,102,728 |
Source: Public Records
Tax History Compared to Growth
Tax History
| Year | Tax Paid | Tax Assessment Tax Assessment Total Assessment is a certain percentage of the fair market value that is determined by local assessors to be the total taxable value of land and additions on the property. | Land | Improvement |
|---|---|---|---|---|
| 2025 | $2,302 | $58,800 | $7,760 | $51,040 |
| 2024 | $3,011 | $58,800 | $7,760 | $51,040 |
| 2023 | $1,682 | $68,716 | $7,760 | $60,956 |
| 2022 | $1,482 | $42,708 | $7,760 | $34,948 |
| 2021 | $1,614 | $39,532 | $7,760 | $31,772 |
| 2020 | $1,615 | $46,520 | $7,760 | $38,760 |
| 2019 | $1,906 | $46,520 | $7,760 | $38,760 |
| 2018 | $1,906 | $46,520 | $7,760 | $38,760 |
| 2017 | $1,912 | $46,520 | $7,760 | $38,760 |
Source: Public Records
Map
Nearby Homes