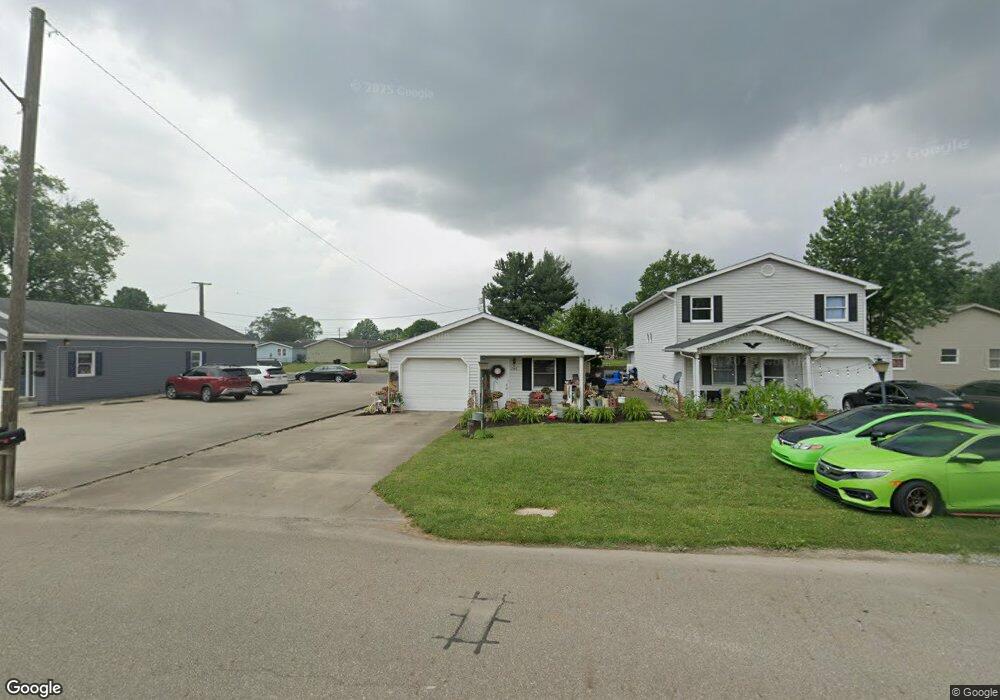
1346 Kaderly St NW Unit A New Philadelphia, OH 44663
Estimated Value: $133,000 - $184,000
4
Beds
2
Baths
1,392
Sq Ft
$110/Sq Ft
Est. Value
About This Home
This home is located at 1346 Kaderly St NW Unit A, New Philadelphia, OH 44663 and is currently estimated at $153,000, approximately $109 per square foot. 1346 Kaderly St NW Unit A is a home located in Tuscarawas County with nearby schools including New Philadelphia High School, Tuscarawas Central Catholic Elementary School, and Tuscarawas Central Catholic Junior/Senior High School.
Ownership History
Date
Name
Owned For
Owner Type
Purchase Details
Closed on
Nov 6, 2024
Sold by
Rbk Holdings Llc
Bought by
Dwell Pointe Llc
Current Estimated Value
Purchase Details
Closed on
Nov 16, 2012
Sold by
Sewell Joan A
Bought by
Rbk Holdings Llc
Purchase Details
Closed on
Apr 22, 2004
Sold by
Sewell Joan A
Bought by
Sewell Joan A
Purchase Details
Closed on
Mar 29, 2002
Sold by
Stocker Dev Ltd
Bought by
Sewell Juan A
Purchase Details
Closed on
Dec 17, 1991
Bought by
Rbk Holdings Llc
Purchase Details
Closed on
Feb 24, 1989
Sold by
Lawver Gary L
Bought by
Pristine Managing Corporation
Purchase Details
Closed on
Oct 24, 1988
Sold by
Hall Virginia S
Bought by
Rbk Holdings Llc
Purchase Details
Closed on
Mar 12, 1986
Sold by
Hall Virginia S
Bought by
Rbk Holdings Llc
Create a Home Valuation Report for This Property
The Home Valuation Report is an in-depth analysis detailing your home's value as well as a comparison with similar homes in the area
Home Values in the Area
Average Home Value in this Area
Purchase History
| Date | Buyer | Sale Price | Title Company |
|---|---|---|---|
| Dwell Pointe Llc | $135,000 | Alban Title | |
| Dwell Pointe Llc | $135,000 | Alban Title | |
| Rbk Holdings Llc | $110,000 | None Available | |
| Sewell Joan A | -- | -- | |
| Sewell Juan A | $236,500 | -- | |
| Rbk Holdings Llc | -- | -- | |
| Pristine Managing Corporation | $26,000 | -- | |
| Rbk Holdings Llc | $20,000 | -- | |
| Rbk Holdings Llc | $37,500 | -- |
Source: Public Records
Tax History Compared to Growth
Tax History
| Year | Tax Paid | Tax Assessment Tax Assessment Total Assessment is a certain percentage of the fair market value that is determined by local assessors to be the total taxable value of land and additions on the property. | Land | Improvement |
|---|---|---|---|---|
| 2024 | $2,220 | $56,370 | $7,000 | $49,370 |
| 2023 | $2,220 | $161,060 | $20,000 | $141,060 |
| 2022 | $2,234 | $56,371 | $7,000 | $49,371 |
| 2021 | $1,812 | $43,019 | $6,223 | $36,796 |
| 2020 | $1,822 | $43,019 | $6,223 | $36,796 |
| 2019 | $1,820 | $43,019 | $6,223 | $36,796 |
| 2018 | $1,609 | $36,300 | $5,250 | $31,050 |
| 2017 | $1,597 | $36,300 | $5,250 | $31,050 |
| 2016 | $163 | $36,300 | $5,250 | $31,050 |
| 2014 | $1,524 | $32,810 | $5,600 | $27,210 |
| 2013 | $1,264 | $32,810 | $5,600 | $27,210 |
Source: Public Records
Map
Nearby Homes
- 1331 Kelly St NW
- 334 Monroe St
- 1003 Kaderly St NW
- 415 Bowers Ave NW
- 825 Zella Ave NW
- 414 E Wills Ave
- 919 Oak St NW
- 221 S James St
- 245 E Wills Ave
- 644 Orchard Ave NW
- 725 Kaderly St NW
- 671 Orchard Ave NW
- 605 Bond St
- 1023 Prospect Ave NW
- 633 4th St NW
- 1319 Terrace Rd NW
- 214 Liberty St
- 403 5th St NW
- 836 Miller Ave NW
- 635 Jordan Dr NW
- 1350 Kaderly St NW Unit A
- 1360 Kaderly St NW
- 1330 Kaderly St NW
- 1349 5th St NW Unit A
- 1345 5th St NW Unit A
- 466 Chauncey Ave NW Unit A
- 466 Chauncey Ave NW Unit A & B
- 1341 5th St NW Unit A
- 1320 Kaderly St NW
- 1335 5th St NW
- 1353 Kaderly St NW
- 1341 Kaderly St NW
- 1337 Kaderly St NW
- 1335 Kaderly St NW
- 1329 5th St NW
- 1359 5th St NW Unit A
- 1404 Kaderly St NW
- 1333 Kaderly St NW
- 453 Chauncey Ave NW
- 1323 5th St NW