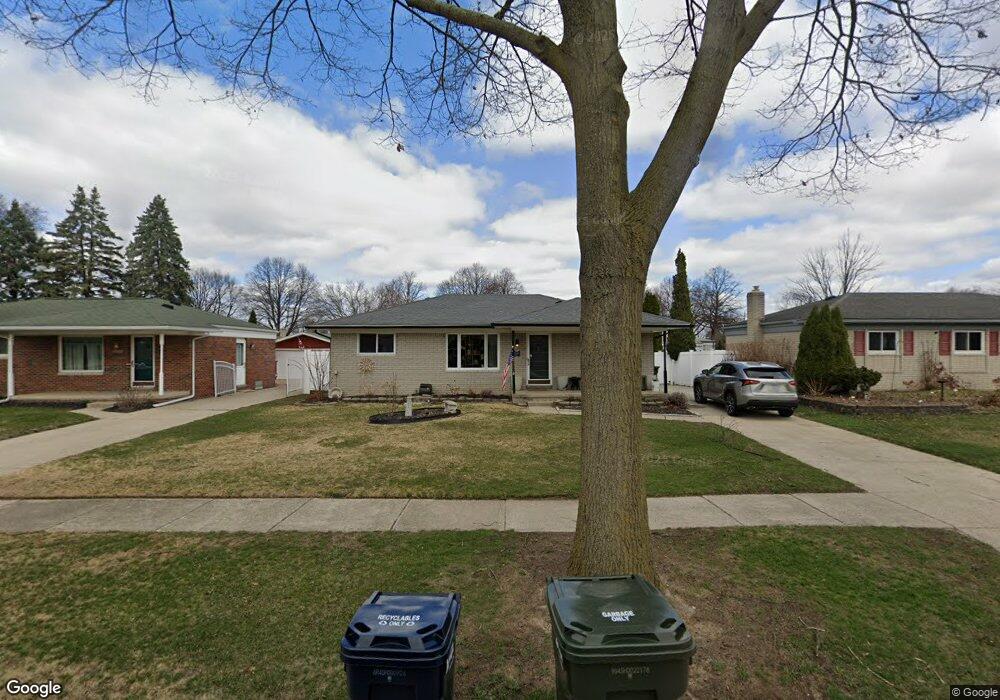
13461 Bernadette Ct Sterling Heights, MI 48313
Estimated Value: $262,000 - $334,000
3
Beds
1
Bath
1,167
Sq Ft
$249/Sq Ft
Est. Value
About This Home
This home is located at 13461 Bernadette Ct, Sterling Heights, MI 48313 and is currently estimated at $290,465, approximately $248 per square foot. 13461 Bernadette Ct is a home located in Macomb County with nearby schools including Havel Elementary School, Bemis Junior High School, and Henry Ford II High School.
Ownership History
Date
Name
Owned For
Owner Type
Purchase Details
Closed on
Sep 30, 2014
Sold by
Darragh Charles E and Darragh Terrie L
Bought by
Darragh Charles E and Darragh Terrie L
Current Estimated Value
Purchase Details
Closed on
Apr 12, 2011
Sold by
Izzi Carlo
Bought by
Izzi Carlo and Weeden Heidi
Purchase Details
Closed on
Apr 5, 2011
Sold by
Gmac Mortgage Llc
Bought by
Izzi Carlo
Purchase Details
Closed on
Jun 11, 2010
Sold by
Gohsman Rebecca Marie
Bought by
Gmac Mortgage Llc
Purchase Details
Closed on
Aug 12, 2005
Sold by
Hildreth Scott and Hildreth Victoria L
Bought by
Gohsman Rebecca Marie
Purchase Details
Closed on
Aug 11, 1999
Sold by
Grove Theresa M
Bought by
Hildreth Scott
Home Financials for this Owner
Home Financials are based on the most recent Mortgage that was taken out on this home.
Original Mortgage
$151,000
Interest Rate
7.91%
Mortgage Type
Purchase Money Mortgage
Create a Home Valuation Report for This Property
The Home Valuation Report is an in-depth analysis detailing your home's value as well as a comparison with similar homes in the area
Home Values in the Area
Average Home Value in this Area
Purchase History
| Date | Buyer | Sale Price | Title Company |
|---|---|---|---|
| Darragh Charles E | -- | None Available | |
| Darragh Charles E | $160,000 | Visionary Title Agency Llc | |
| Izzi Carlo | -- | E Title Agency Inc | |
| Izzi Carlo | $72,900 | Etitle Agency Inc | |
| Gmac Mortgage Llc | $85,000 | None Available | |
| Gohsman Rebecca Marie | $186,900 | Metropolitan Title Company | |
| Hildreth Scott | $151,500 | -- |
Source: Public Records
Mortgage History
| Date | Status | Borrower | Loan Amount |
|---|---|---|---|
| Previous Owner | Hildreth Scott | $151,000 |
Source: Public Records
Tax History Compared to Growth
Tax History
| Year | Tax Paid | Tax Assessment Tax Assessment Total Assessment is a certain percentage of the fair market value that is determined by local assessors to be the total taxable value of land and additions on the property. | Land | Improvement |
|---|---|---|---|---|
| 2025 | $3,368 | $132,900 | $0 | $0 |
| 2024 | $3,080 | $125,800 | $0 | $0 |
| 2023 | $2,908 | $113,600 | $0 | $0 |
| 2022 | $3,031 | $100,000 | $0 | $0 |
| 2021 | $2,969 | $96,000 | $0 | $0 |
| 2020 | $2,648 | $88,500 | $0 | $0 |
| 2019 | $2,713 | $85,200 | $0 | $0 |
| 2018 | $2,746 | $82,100 | $0 | $0 |
| 2017 | $2,621 | $76,900 | $13,500 | $63,400 |
| 2016 | $2,532 | $76,900 | $0 | $0 |
| 2015 | -- | $70,400 | $0 | $0 |
| 2014 | -- | $58,000 | $0 | $0 |
Source: Public Records
Map
Nearby Homes
- 13431 Melanie Dr
- 13374 Wessel Ct
- 41222 Paign Dr
- 13689 Ridgepoint Dr
- 13980 Amanda Dr
- 14160 Alpena Dr
- 12646 Bender Dr
- 13936 Grove Park Dr
- 14239 Alpena Dr
- 13722 Diversion Dr
- 14289 Hope Dr
- 14554 Alma Dr
- 13762 Halleck Dr
- 13104 Carnaby Ct
- 42708 Wilmington Dr
- 42153 Mac Rae Dr
- 42222 Mac Rae Dr
- 13299 Jennilynn Ln
- 42811 Wilmington Dr
- 40779 Cascade Dr
- 13449 Bernadette Ct
- 13473 Bernadette Ct
- 13437 Bernadette Ct
- 13468 Melanie Dr
- 13456 Melanie Dr
- 13485 Bernadette Ct
- 13480 Melanie Dr
- 13444 Melanie Dr
- 13425 Bernadette Ct Unit Bldg-Unit
- 13425 Bernadette Ct
- 13496 Melanie Dr
- 13472 Bernadette Ct
- 13432 Melanie Dr
- 13460 Bernadette Ct
- 13448 Bernadette Ct
- 13411 Bernadette Ct
- 13436 Bernadette Ct
- 13424 Bernadette Ct
- 13416 Melanie Dr
- 13467 Melanie Dr