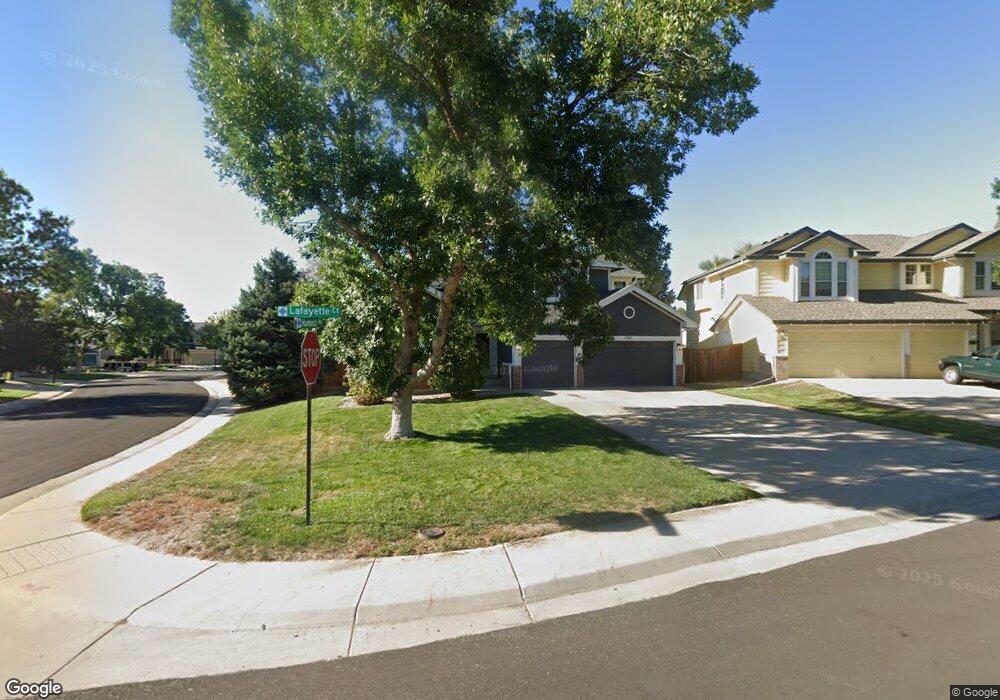
13463 Lafayette Ct Thornton, CO 80241
Hunters Glen NeighborhoodEstimated Value: $611,610 - $687,000
3
Beds
3
Baths
3,552
Sq Ft
$184/Sq Ft
Est. Value
About This Home
This home is located at 13463 Lafayette Ct, Thornton, CO 80241 and is currently estimated at $654,153, approximately $184 per square foot. 13463 Lafayette Ct is a home located in Adams County with nearby schools including Hunters Glen Elementary School, Century Middle School, and Mountain Range High School.
Ownership History
Date
Name
Owned For
Owner Type
Purchase Details
Closed on
Jun 21, 2013
Sold by
Duhadway Frank I and Duhadway Ruth L
Bought by
Miller Timothy P and Miller Holly M
Current Estimated Value
Home Financials for this Owner
Home Financials are based on the most recent Mortgage that was taken out on this home.
Original Mortgage
$312,219
Outstanding Balance
$216,637
Interest Rate
3.25%
Mortgage Type
FHA
Estimated Equity
$437,516
Purchase Details
Closed on
Sep 26, 1997
Sold by
Schmidt John T and Schmidt Barbara M
Bought by
Duhadway Frank I and Duhadway Ruth L
Home Financials for this Owner
Home Financials are based on the most recent Mortgage that was taken out on this home.
Original Mortgage
$149,200
Interest Rate
7.49%
Purchase Details
Closed on
Jan 30, 1995
Sold by
Weekley Homes Inc
Bought by
Schmidt John T and Schmidt Barbara M
Home Financials for this Owner
Home Financials are based on the most recent Mortgage that was taken out on this home.
Original Mortgage
$174,900
Interest Rate
7.37%
Create a Home Valuation Report for This Property
The Home Valuation Report is an in-depth analysis detailing your home's value as well as a comparison with similar homes in the area
Home Values in the Area
Average Home Value in this Area
Purchase History
| Date | Buyer | Sale Price | Title Company |
|---|---|---|---|
| Miller Timothy P | $323,000 | Chicago Title Co | |
| Duhadway Frank I | $219,000 | First American Heritage Titl | |
| Schmidt John T | $218,671 | Stewart Title |
Source: Public Records
Mortgage History
| Date | Status | Borrower | Loan Amount |
|---|---|---|---|
| Open | Miller Timothy P | $312,219 | |
| Previous Owner | Duhadway Frank I | $149,200 | |
| Previous Owner | Schmidt John T | $174,900 |
Source: Public Records
Tax History
| Year | Tax Paid | Tax Assessment Tax Assessment Total Assessment is a certain percentage of the fair market value that is determined by local assessors to be the total taxable value of land and additions on the property. | Land | Improvement |
|---|---|---|---|---|
| 2025 | $4,244 | $42,710 | $9,320 | $33,390 |
| 2024 | $4,244 | $39,250 | $8,560 | $30,690 |
| 2023 | $4,200 | $44,720 | $8,460 | $36,260 |
| 2022 | $3,568 | $32,390 | $8,410 | $23,980 |
| 2021 | $3,687 | $32,390 | $8,410 | $23,980 |
| 2020 | $3,574 | $32,040 | $8,650 | $23,390 |
| 2019 | $3,582 | $32,040 | $8,650 | $23,390 |
| 2018 | $3,343 | $29,050 | $7,490 | $21,560 |
| 2017 | $3,039 | $29,050 | $7,490 | $21,560 |
| 2016 | $2,774 | $25,810 | $5,650 | $20,160 |
| 2015 | $2,770 | $25,810 | $5,650 | $20,160 |
| 2014 | $2,837 | $16,630 | $3,340 | $13,290 |
Source: Public Records
Map
Nearby Homes
- 13508 Vine St
- 1960 E 135th Place
- 1672 E 131st Ct
- 7 Sandpiper Cir
- 1174 E 130th Dr
- 13550 Washington St Unit 7C
- 58 Blue Heron Dr
- 13337 Elizabeth Ct
- 2942 E 135th Place
- 13262 Pearl Cir
- 12905 Lafayette St Unit H
- 12885 Vine St
- 2275 E 129th Ave
- 2746 E 132nd Place
- 13486 Clayton St
- 13142 Pennsylvania Cir
- 491 E 133rd Way
- 1981 E 141st Ave
- 2297 E 128th Ave
- 2973 E 133rd Ln
- 13473 Lafayette Ct
- 13448 Marion St
- 13458 Marion St
- 13443 Humboldt Way
- 13483 Lafayette Ct
- 13468 Marion St
- 13445 Humboldt Way
- 13488 Marion St
- 13460 Lafayette Ct
- 13450 Lafayette Ct
- 13490 Lafayette Ct
- 13494 Marion St
- 13447 Humboldt Way
- 13478 Marion St
- 13480 Lafayette Ct
- 13470 Lafayette Ct
- 13453 Lafayette Ct
- 13440 Lafayette Ct
- 13459 Marion St
- 13449 Marion St
Your Personal Tour Guide
Ask me questions while you tour the home.