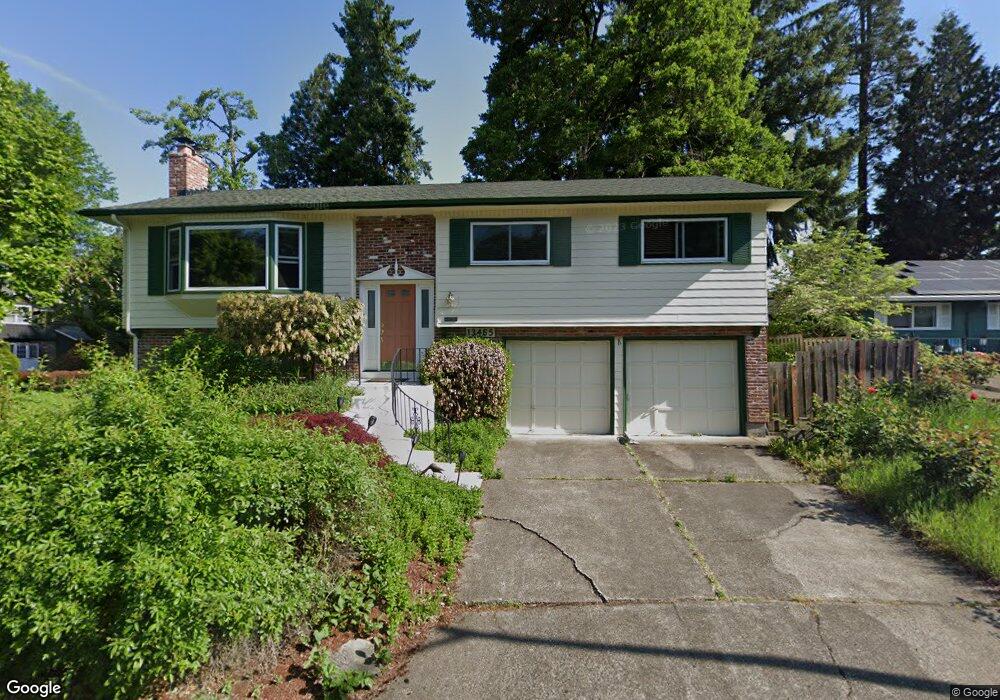
13465 NW Marshall St Portland, OR 97229
Estimated Value: $630,000 - $651,000
4
Beds
3
Baths
1,200
Sq Ft
$533/Sq Ft
Est. Value
About This Home
This home is located at 13465 NW Marshall St, Portland, OR 97229 and is currently estimated at $639,630, approximately $533 per square foot. 13465 NW Marshall St is a home located in Washington County with nearby schools including Terra Linda Elementary School, Sunset High School, and St. Pius X. School.
Ownership History
Date
Name
Owned For
Owner Type
Purchase Details
Closed on
Apr 29, 2021
Sold by
Nesbitt Allen S
Bought by
Nesbitt Allen S and Nesbitt Allen S
Current Estimated Value
Purchase Details
Closed on
Jun 14, 2018
Sold by
Nesbitt Allen S
Bought by
Nesbitt Allen S
Home Financials for this Owner
Home Financials are based on the most recent Mortgage that was taken out on this home.
Original Mortgage
$8
Outstanding Balance
$7
Interest Rate
4.5%
Estimated Equity
$639,623
Purchase Details
Closed on
Apr 10, 2006
Sold by
Weleber Barbara Carolyn and Detroit Sandra C
Bought by
Nesbitt Allen S and Nesbitt Carolyn O
Home Financials for this Owner
Home Financials are based on the most recent Mortgage that was taken out on this home.
Original Mortgage
$220,500
Outstanding Balance
$135,706
Interest Rate
7.62%
Mortgage Type
Unknown
Estimated Equity
$503,924
Purchase Details
Closed on
Aug 1, 1997
Sold by
Berry Barbara L
Bought by
Livi Berry Barbara L and Barbara L Berry Revocable Living Trust
Create a Home Valuation Report for This Property
The Home Valuation Report is an in-depth analysis detailing your home's value as well as a comparison with similar homes in the area
Home Values in the Area
Average Home Value in this Area
Purchase History
| Date | Buyer | Sale Price | Title Company |
|---|---|---|---|
| Nesbitt Allen S | -- | None Available | |
| Nesbitt Allen S | -- | None Available | |
| Nesbitt Allen S | $315,000 | Transnation Title Agency Or | |
| Livi Berry Barbara L | -- | -- |
Source: Public Records
Mortgage History
| Date | Status | Borrower | Loan Amount |
|---|---|---|---|
| Open | Nesbitt Allen S | $8 | |
| Open | Nesbitt Allen S | $220,500 |
Source: Public Records
Tax History Compared to Growth
Tax History
| Year | Tax Paid | Tax Assessment Tax Assessment Total Assessment is a certain percentage of the fair market value that is determined by local assessors to be the total taxable value of land and additions on the property. | Land | Improvement |
|---|---|---|---|---|
| 2025 | $5,390 | $294,780 | -- | -- |
| 2024 | $5,063 | $286,200 | -- | -- |
| 2023 | $5,063 | $277,870 | $0 | $0 |
| 2022 | $4,894 | $277,870 | $0 | $0 |
| 2021 | $4,718 | $261,930 | $0 | $0 |
| 2020 | $4,575 | $254,310 | $0 | $0 |
| 2019 | $4,431 | $246,910 | $0 | $0 |
| 2018 | $4,286 | $239,720 | $0 | $0 |
| 2017 | $4,133 | $232,740 | $0 | $0 |
| 2016 | $3,986 | $225,970 | $0 | $0 |
| 2015 | $3,852 | $219,390 | $0 | $0 |
| 2014 | $3,782 | $213,000 | $0 | $0 |
Source: Public Records
Map
Nearby Homes
- 1625 NW 136th Ave
- 1470 NW 136th Ave
- 1545 NW 131st Ave
- 1632 NW 143rd Ave
- 1914 NW 143rd Ave Unit 28
- 1914 NW 143rd Ave Unit 25
- 13187 NW Burton St
- 1946 NW 143rd Ave Unit 92
- 1950 NW 143rd Ave Unit 99
- 1750 NW 143rd Ave
- 1700 NW Saltzman Rd
- 1924 NW 143rd Ave Unit 58
- 2361 NW Origami Ct
- 1771 NW 143rd Ave Unit 40
- 14280 NW Burton St
- 12274 NW Coleman Dr
- 13159 NW Dumar St
- 12170 NW Marshall St
- 13007 NW Harvest Lot 6 St
- 13021 NW Harvest St
- 13480 NW Northrup St
- 13440 NW Northrup St
- 1685 NW Jenne Ave
- 1705 NW Jenne Ave
- 13405 NW Marshall St
- 13460 NW Marshall St
- 1665 NW Jenne Ave
- 13430 NW Marshall St
- 1725 NW Jenne Ave
- 13375 NW Marshall St
- 13400 NW Marshall St
- 1645 NW Jenne Ave
- 1690 NW 136th Ave
- 1710 NW 136th Ave
- 1745 NW Jenne Ave
- 1630 NW Jenne Ave
- 13485 NW Northrup St
- 1670 NW 136th Ave
- 13445 NW Northrup St
- 1730 NW 136th Ave