Estimated Value: $538,000 - $819,677
--
Bed
1
Bath
5,692
Sq Ft
$119/Sq Ft
Est. Value
About This Home
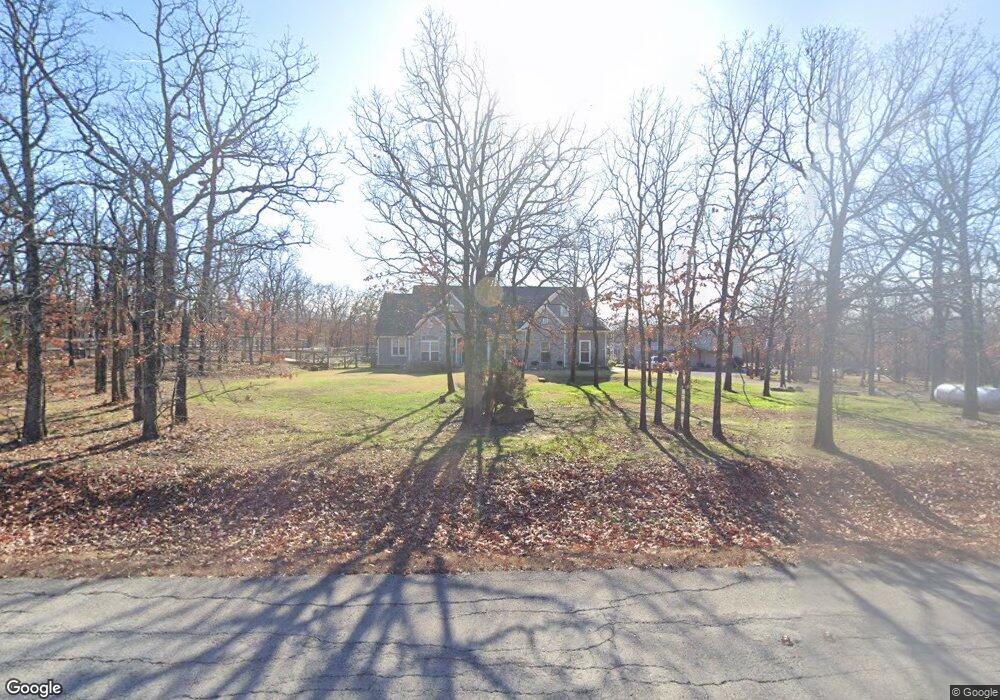
This home is located at 13466 E 205th St S, Bixby, OK 74008 and is currently estimated at $678,839, approximately $119 per square foot. 13466 E 205th St S is a home with nearby schools including Central Elementary School, Bixby Central Intermediate School, and Bixby Middle School.
Ownership History
Date
Name
Owned For
Owner Type
Purchase Details
Closed on
Feb 20, 2015
Sold by
Reynolds Paul A and Reynolds Jaimie A
Bought by
Reynolds Paul A and Reynolds Jaime A
Current Estimated Value
Home Financials for this Owner
Home Financials are based on the most recent Mortgage that was taken out on this home.
Original Mortgage
$265,000
Outstanding Balance
$202,369
Interest Rate
3.68%
Mortgage Type
VA
Estimated Equity
$476,470
Purchase Details
Closed on
Nov 10, 2008
Sold by
Smith John C and Smith Dedera A
Bought by
Reynolds Paul A and Reynolds Jaimie A
Home Financials for this Owner
Home Financials are based on the most recent Mortgage that was taken out on this home.
Original Mortgage
$35,000
Interest Rate
5.99%
Mortgage Type
Purchase Money Mortgage
Purchase Details
Closed on
May 10, 2000
Sold by
Baysinger Brian R and Baysinger Julie L
Bought by
Smith John C and Smith Dedera A
Purchase Details
Closed on
Mar 4, 1999
Sold by
Lee Fu Ming and Lee Mina
Bought by
Baysinger Brian R and Baysinger Julie L
Create a Home Valuation Report for This Property
The Home Valuation Report is an in-depth analysis detailing your home's value as well as a comparison with similar homes in the area
Home Values in the Area
Average Home Value in this Area
Purchase History
| Date | Buyer | Sale Price | Title Company |
|---|---|---|---|
| Reynolds Paul A | -- | Tulsa Abstract & Title Co | |
| Reynolds Paul A | $36,000 | None Available | |
| Smith John C | $23,500 | -- | |
| Baysinger Brian R | $18,000 | Guaranty Abstract Company |
Source: Public Records
Mortgage History
| Date | Status | Borrower | Loan Amount |
|---|---|---|---|
| Open | Reynolds Paul A | $265,000 | |
| Previous Owner | Reynolds Paul A | $35,000 |
Source: Public Records
Tax History Compared to Growth
Tax History
| Year | Tax Paid | Tax Assessment Tax Assessment Total Assessment is a certain percentage of the fair market value that is determined by local assessors to be the total taxable value of land and additions on the property. | Land | Improvement |
|---|---|---|---|---|
| 2024 | $6,208 | $45,734 | $2,006 | $43,728 |
| 2023 | $6,208 | $45,372 | $4,201 | $41,171 |
| 2022 | $6,049 | $43,051 | $3,986 | $39,065 |
| 2021 | $5,485 | $41,768 | $3,867 | $37,901 |
| 2020 | $5,520 | $41,768 | $3,867 | $37,901 |
| 2019 | $5,541 | $41,768 | $3,867 | $37,901 |
| 2018 | $5,490 | $41,768 | $3,867 | $37,901 |
| 2017 | $5,454 | $42,768 | $3,960 | $38,808 |
| 2016 | $5,388 | $42,768 | $3,960 | $0 |
| 2015 | $489 | $3,960 | $3,960 | $0 |
| 2014 | $488 | $3,960 | $3,960 | $0 |
Source: Public Records
Map
Nearby Homes
- 20101 S 137th East Ave
- 10 E 205th St S
- 20137 S 137th East Ave
- 14215 E 208th St S
- 14500 E 202nd St S
- 14250 E 202nd St S
- S 145th East Ave
- 0 S 145th Ave Unit 2524079
- 151 S E Ave S
- 19682 S 145th Ave E
- 19638 S Garnett Rd
- 18342 S 132nd East Ave
- 9916 E 206th St
- 18235 S 129th East Ave
- 0 East Ave Unit 2524879
- 17104 S 129th East Ave
- N320 Road
- 12920 E 183rd St S
- 21500 S Mingo Rd
- 18401 S 129th Ave E
- 13364 E 205th St S
- 13558 E 205th St S
- 13558 E 205th St S
- 13262 E 205th St S
- 13439 E 205th St S
- 20538 S 137th East Ave
- 13521 E 205th St S
- 20512 S 137th East Ave
- 20539 S 137th East Ave
- 20513 S 137th East Ave
- 13136 E 205th St S
- 13261 E 205th St S
- 20438 S 137th East Ave
- 20477 S 137th East Ave
- 20615 S 138th Ave E
- 20322 S 137th East Ave
- 13818 E 205th St S
- 20377 S 137th East Ave
- 20377 S 137th Ave E
- 20362 S 131st East Ave