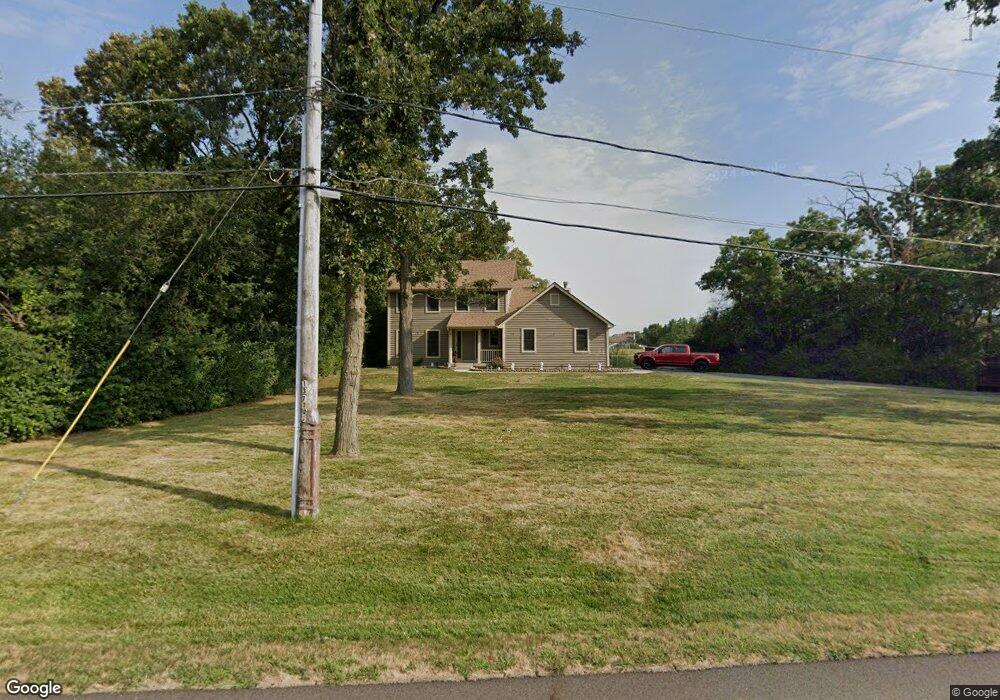
13466 W Chaplin St Wadsworth, IL 60083
Estimated Value: $381,000 - $514,000
3
Beds
3
Baths
1,944
Sq Ft
$217/Sq Ft
Est. Value
About This Home
This home is located at 13466 W Chaplin St, Wadsworth, IL 60083 and is currently estimated at $421,818, approximately $216 per square foot. 13466 W Chaplin St is a home located in Lake County with nearby schools including Spaulding Elementary School, Viking Middle School, and Warren Township High School.
Ownership History
Date
Name
Owned For
Owner Type
Purchase Details
Closed on
Jan 25, 2011
Sold by
Yarc Keith A
Bought by
Yarc Darla J
Current Estimated Value
Purchase Details
Closed on
Dec 19, 2003
Sold by
Sjoholm Allan J
Bought by
Yarc Keith A and Yarc Darla J
Home Financials for this Owner
Home Financials are based on the most recent Mortgage that was taken out on this home.
Original Mortgage
$165,000
Outstanding Balance
$76,244
Interest Rate
5.84%
Mortgage Type
Purchase Money Mortgage
Estimated Equity
$345,574
Purchase Details
Closed on
Oct 27, 1994
Sold by
Grand National Bank
Bought by
Sjoholm Allan J
Home Financials for this Owner
Home Financials are based on the most recent Mortgage that was taken out on this home.
Original Mortgage
$150,000
Interest Rate
3.9%
Create a Home Valuation Report for This Property
The Home Valuation Report is an in-depth analysis detailing your home's value as well as a comparison with similar homes in the area
Home Values in the Area
Average Home Value in this Area
Purchase History
| Date | Buyer | Sale Price | Title Company |
|---|---|---|---|
| Yarc Darla J | -- | None Available | |
| Yarc Keith A | $265,000 | -- | |
| Sjoholm Allan J | $203,000 | Chicago Title Insurance Co |
Source: Public Records
Mortgage History
| Date | Status | Borrower | Loan Amount |
|---|---|---|---|
| Open | Yarc Keith A | $165,000 | |
| Previous Owner | Sjoholm Allan J | $150,000 | |
| Closed | Yarc Keith A | $73,500 |
Source: Public Records
Tax History Compared to Growth
Tax History
| Year | Tax Paid | Tax Assessment Tax Assessment Total Assessment is a certain percentage of the fair market value that is determined by local assessors to be the total taxable value of land and additions on the property. | Land | Improvement |
|---|---|---|---|---|
| 2024 | $8,804 | $102,971 | $23,544 | $79,427 |
| 2023 | $8,426 | $97,381 | $20,541 | $76,840 |
| 2022 | $8,426 | $92,247 | $18,752 | $73,495 |
| 2021 | $7,230 | $83,943 | $17,087 | $66,856 |
| 2020 | $7,019 | $81,992 | $16,690 | $65,302 |
| 2019 | $6,790 | $78,740 | $16,028 | $62,712 |
| 2018 | $6,572 | $76,246 | $15,433 | $60,813 |
| 2017 | $6,527 | $74,832 | $15,147 | $59,685 |
| 2016 | $6,411 | $72,329 | $14,640 | $57,689 |
| 2015 | $6,197 | $68,306 | $13,826 | $54,480 |
| 2014 | $5,742 | $66,433 | $13,447 | $52,986 |
| 2012 | $5,911 | $67,540 | $13,671 | $53,869 |
Source: Public Records
Map
Nearby Homes
- 38603 N Pine Grove Ave
- 13076 W Pickford St
- 13910 W Elm Ln
- 12920 W Wadsworth Rd
- 39111 N Aberdeen Ln Unit 39111
- 39124 Welsh Ln Unit 5521
- 39092 Welsh Ln Unit 5501
- 13155 W Yorkshire Ln
- 39616 N Warren Ln Unit 4824
- 39631 N Warren Ln Unit 4625
- 38715 N Red Oak Terrace
- 12640 W Wadsworth Rd
- 38859 N Green Bay Rd
- 12582 W Beach Rd
- 39694 N Warren Ln Unit 4763
- 39113 N Green Bay Rd
- 38148 N Helena Ln
- 13661 W Adams Rd
- 13551 W Adams Rd
- 39787 Torry Ln
- 38777 N Northwestern Ave
- 38811 N Northwestern Ave
- 13425 W Chaplin St
- 38786 N Northwestern Ave
- 38849 N Northwestern Ave
- 13389 W Chaplin St
- 38688 N Waveland Ave
- 13358 W Chaplin St
- 38850 N Northwestern Ave
- 38711 N Woodland Ave
- 38688 N Magnolia Ave
- 13357 W Chaplin St
- 38644 N Waveland Ave
- 13334 W Chaplin St
- 38812 N Pine Grove Ave
- 38854 N Pine Grove Ave
- 13424 W Hart St
- 38915 N Northwestern Ave
- 13388 W Hart St
- 13577 W Chaplin St