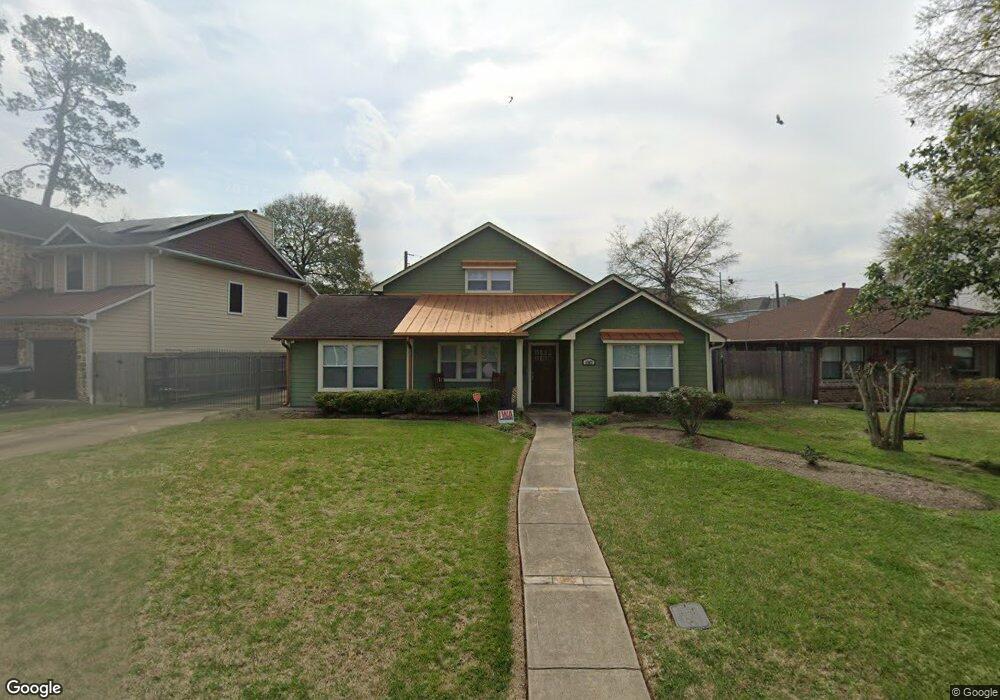
1347 Ebony Ln Houston, TX 77018
Oak Forest-Garden Oaks NeighborhoodEstimated Value: $822,000 - $895,000
3
Beds
3
Baths
2,350
Sq Ft
$363/Sq Ft
Est. Value
About This Home
This home is located at 1347 Ebony Ln, Houston, TX 77018 and is currently estimated at $853,963, approximately $363 per square foot. 1347 Ebony Ln is a home located in Harris County with nearby schools including Oak Forest Elementary School, Frank Black Middle School, and Waltrip High School.
Ownership History
Date
Name
Owned For
Owner Type
Purchase Details
Closed on
Apr 7, 2009
Sold by
Clark Mark W
Bought by
Marcon Maureen
Current Estimated Value
Home Financials for this Owner
Home Financials are based on the most recent Mortgage that was taken out on this home.
Original Mortgage
$304,800
Outstanding Balance
$194,947
Interest Rate
5.16%
Mortgage Type
Purchase Money Mortgage
Estimated Equity
$659,016
Purchase Details
Closed on
Apr 27, 2007
Sold by
Lafferty Franklin Horton
Bought by
Clark Mark W
Home Financials for this Owner
Home Financials are based on the most recent Mortgage that was taken out on this home.
Original Mortgage
$250,000
Interest Rate
6.1%
Mortgage Type
Purchase Money Mortgage
Purchase Details
Closed on
May 8, 2006
Sold by
Bresser Wanda and Lafferty Wanda
Bought by
Lafferty Jerry W
Create a Home Valuation Report for This Property
The Home Valuation Report is an in-depth analysis detailing your home's value as well as a comparison with similar homes in the area
Home Values in the Area
Average Home Value in this Area
Purchase History
| Date | Buyer | Sale Price | Title Company |
|---|---|---|---|
| Marcon Maureen | -- | Etc | |
| Clark Mark W | -- | None Available | |
| Lafferty Jerry W | -- | None Available |
Source: Public Records
Mortgage History
| Date | Status | Borrower | Loan Amount |
|---|---|---|---|
| Open | Marcon Maureen | $304,800 | |
| Previous Owner | Clark Mark W | $250,000 |
Source: Public Records
Tax History Compared to Growth
Tax History
| Year | Tax Paid | Tax Assessment Tax Assessment Total Assessment is a certain percentage of the fair market value that is determined by local assessors to be the total taxable value of land and additions on the property. | Land | Improvement |
|---|---|---|---|---|
| 2025 | $12,272 | $755,044 | $443,165 | $311,879 |
| 2024 | $12,272 | $813,558 | $443,165 | $370,393 |
| 2023 | $12,272 | $776,969 | $443,165 | $333,804 |
| 2022 | $14,261 | $682,971 | $370,515 | $312,456 |
| 2021 | $13,723 | $588,798 | $355,985 | $232,813 |
| 2020 | $13,803 | $570,018 | $305,130 | $264,888 |
| 2019 | $13,766 | $544,004 | $305,130 | $238,874 |
| 2018 | $10,132 | $512,874 | $290,600 | $222,274 |
| 2017 | $12,968 | $512,874 | $290,600 | $222,274 |
| 2016 | $13,156 | $538,882 | $290,600 | $248,282 |
| 2015 | $8,710 | $488,000 | $290,600 | $197,400 |
| 2014 | $8,710 | $430,000 | $232,480 | $197,520 |
Source: Public Records
Map
Nearby Homes
- 1339 Du Barry Ln
- 1261 Du Barry Ln
- 1249 Chippendale Rd
- 1261 Wakefield Dr
- 1403 Wakefield Dr
- 3506 Oak Forest Dr
- 2116 Oatfield Dr
- 2006 Lou Ellen Ln Unit H
- 2122 Oatfield Dr
- 1226 Du Barry Ln
- 1526 Du Barry Ln
- 1226 Chippendale Rd
- 1316 Althea Dr
- 1438 Wakefield Dr
- 1237 Althea Dr
- 3527 Ella Blvd
- 1225 Althea Dr
- 1249 Gardenia Dr
- 1148 Du Barry Ln
- 2206 Lou Ellen Ln Unit C
- 1351 Ebony Ln
- 1339 Ebony Ln
- 1348 Du Barry Ln
- 1355 Ebony Ln
- 1344 Du Barry Ln
- 1352 Du Barry Ln
- 1340 Du Barry Ln
- 1356 Du Barry Ln
- 1348 Ebony Ln
- 1359 Ebony Ln
- 1352 Ebony Ln
- 1340 Ebony Ln
- 1356 Ebony Ln
- 1360 Du Barry Ln
- 1336 Ebony Ln
- 1363 Ebony Ln
- 1360 Ebony Ln
- 1332 Ebony Ln
- 1364 Du Barry Ln
- 1351 Woodcrest Dr