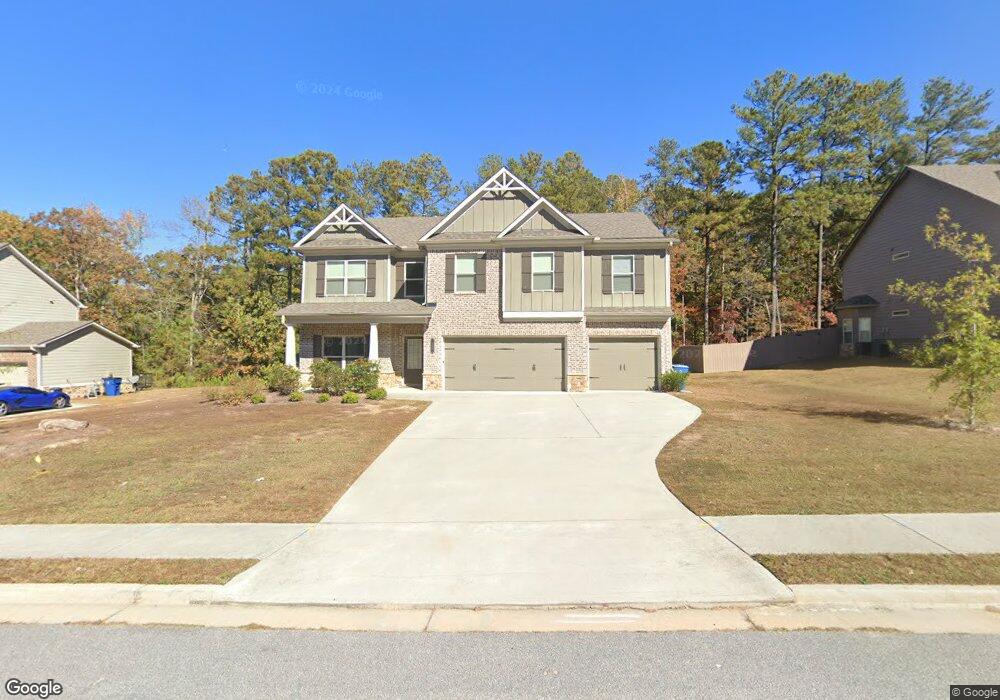
1347 Ewing Chapel Rd Dacula, GA 30019
Estimated Value: $412,000 - $648,814
4
Beds
1
Bath
1,207
Sq Ft
$439/Sq Ft
Est. Value
About This Home
This home is located at 1347 Ewing Chapel Rd, Dacula, GA 30019 and is currently estimated at $529,938, approximately $439 per square foot. 1347 Ewing Chapel Rd is a home located in Gwinnett County with nearby schools including Alcova Elementary School, Dacula Middle School, and Dacula High School.
Ownership History
Date
Name
Owned For
Owner Type
Purchase Details
Closed on
Jun 12, 2024
Sold by
Cm Family Llc
Bought by
Hays Sheri D and Hays Gary M
Current Estimated Value
Purchase Details
Closed on
Jun 29, 2022
Sold by
Goodwin Scott Donald
Bought by
Cm Family Llc
Purchase Details
Closed on
Jul 6, 2017
Sold by
Goodwin Christy Allen
Bought by
Goodwin Scott Donald
Purchase Details
Closed on
Feb 27, 2014
Sold by
Sugarloaf 316 Llc
Bought by
Escrow Corpof Georgia
Purchase Details
Closed on
Feb 25, 2014
Sold by
Nodvin Joseph J
Bought by
Sugarloaf 316 Llc
Purchase Details
Closed on
Jan 29, 2003
Sold by
Turner Bobby E
Bought by
Nodvin Joseph J
Purchase Details
Closed on
Nov 22, 2002
Sold by
Plantation Pipe Line Co
Bought by
Turner Bobby E
Purchase Details
Closed on
Oct 31, 2002
Sold by
Turner Bobby E
Bought by
Nodvin Joseph J
Create a Home Valuation Report for This Property
The Home Valuation Report is an in-depth analysis detailing your home's value as well as a comparison with similar homes in the area
Home Values in the Area
Average Home Value in this Area
Purchase History
| Date | Buyer | Sale Price | Title Company |
|---|---|---|---|
| Hays Sheri D | $5,000,000 | -- | |
| Cm Family Llc | $5,000,000 | -- | |
| Goodwin Scott Donald | -- | -- | |
| Escrow Corpof Georgia | -- | -- | |
| Sugarloaf 316 Llc | -- | -- | |
| Nodvin Joseph J | -- | -- | |
| Turner Bobby E | -- | -- | |
| Nodvin Joseph J | $235,000 | -- |
Source: Public Records
Tax History
| Year | Tax Paid | Tax Assessment Tax Assessment Total Assessment is a certain percentage of the fair market value that is determined by local assessors to be the total taxable value of land and additions on the property. | Land | Improvement |
|---|---|---|---|---|
| 2025 | $6,042 | $163,400 | $119,960 | $43,440 |
| 2024 | $6,108 | $163,400 | $119,960 | $43,440 |
| 2023 | $6,108 | $183,360 | $139,920 | $43,440 |
| 2022 | $0 | $114,880 | $84,600 | $30,280 |
| 2021 | $4,415 | $114,880 | $84,600 | $30,280 |
| 2020 | $4,441 | $114,880 | $84,600 | $30,280 |
| 2019 | $3,680 | $97,720 | $72,080 | $25,640 |
| 2018 | $3,684 | $97,720 | $72,080 | $25,640 |
| 2016 | $3,688 | $97,720 | $72,080 | $25,640 |
| 2015 | $3,733 | $97,720 | $72,080 | $25,640 |
| 2014 | $2,159 | $53,040 | $40,560 | $12,480 |
Source: Public Records
Map
Nearby Homes
- 1269 Victoria Walk Ln
- 1985 Chapel Estates Ln
- 1940 Smarty Jones Dr
- 919 Tumlin Trace
- 1781 Brooks Rd
- 1217 Misty Valley Ct
- 1227 Misty Valley Ct
- 1031 Jordan Rd
- 1950 van Alen Ct
- 1308 Hollingsworth Way
- 1909 van Alen Ct
- 1507 Ewing Chapel Rd
- 871 Wisteria View Ct
- 2479 Mitford Ct
- 2200 Spruce Lake Dr
- 2282 Edgecombe Ln
- 1910 Van Allen Ct
- 1556 Ewing Chapel Rd
- 1070 Leighs Brook Way
- 1560 Ewing Chapel Rd
- 1867 Bloom Ct
- 1862 Bloom Ct
- 1862 Bloom Ct
- 1857 Bloom Ct
- 1327 Ewing Chapel Rd
- 1852 Bloom Ct
- 1852 Bloom Ct
- 1341 Ewing Chapel Rd
- 1200 Victoria Walk Ln
- 1180 Victoria Walk Ln
- 1160 Victoria Walk Ln
- 1210 Victoria Walk Ln
- 1150 Victoria Walk Ln
- 1220 Victoria Walk Ln
- 1220 Victoria Walk Ln
- 1220 Victoria Walk Ln
- 1090 Victoria Walk Ln
- 1140 Victoria Walk Ln
- 1230 Victoria Walk Ln
- 1080 Victoria Walk Ln
Your Personal Tour Guide
Ask me questions while you tour the home.