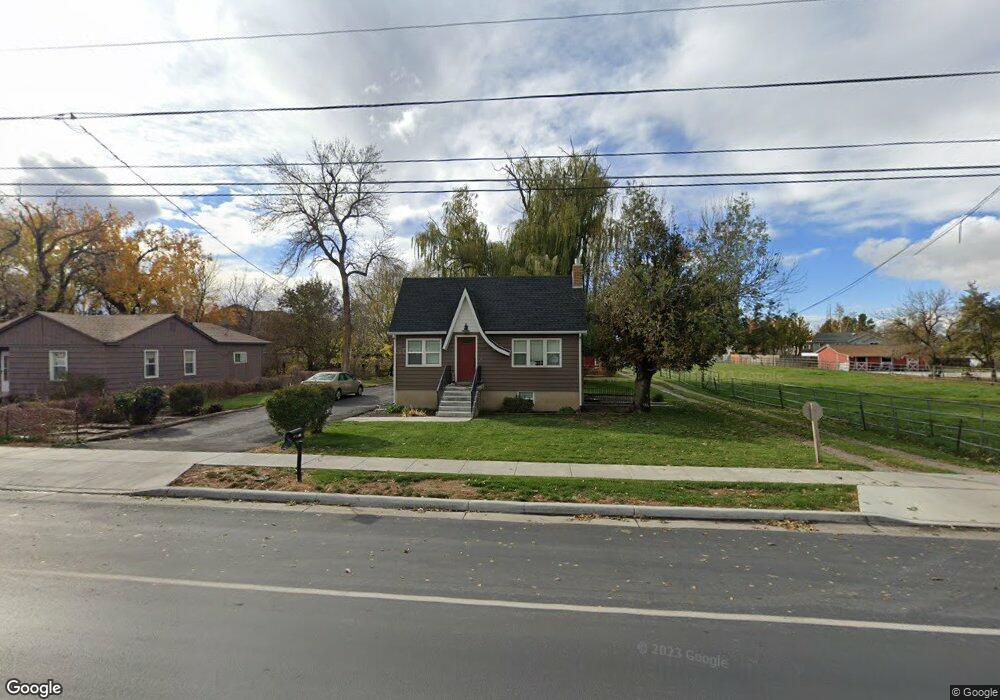
1347 N 800 W West Bountiful, UT 84087
Estimated Value: $601,000 - $918,394
2
Beds
1
Bath
896
Sq Ft
$858/Sq Ft
Est. Value
About This Home
This home is located at 1347 N 800 W, West Bountiful, UT 84087 and is currently estimated at $768,849, approximately $858 per square foot. 1347 N 800 W is a home located in Davis County with nearby schools including West Bountiful Elementary School, Bountiful Junior High School, and Viewmont High School.
Ownership History
Date
Name
Owned For
Owner Type
Purchase Details
Closed on
Dec 29, 2017
Sold by
Dlmsc Llc
Bought by
Christensen Jed Edward and Christensen Cindy
Current Estimated Value
Purchase Details
Closed on
Mar 17, 2016
Sold by
Dmc Holdings
Bought by
Dlmsc Llc
Purchase Details
Closed on
Jun 12, 2002
Sold by
Christensen Don L and Christensen Marva S
Bought by
Dmc Holdings
Purchase Details
Closed on
May 15, 2002
Sold by
Dmc Holdings
Bought by
Christensen Don L and Christensen Marva S
Purchase Details
Closed on
Oct 15, 1999
Sold by
Dlmsc Ltd Partnership
Bought by
Dmc Holdings
Purchase Details
Closed on
Oct 7, 1999
Sold by
Christensen Don L
Bought by
Dlmsc Ltd Partnership
Purchase Details
Closed on
Oct 21, 1998
Sold by
Dlmsc Ltd Partnership
Bought by
Christensen Don L
Purchase Details
Closed on
Feb 17, 1998
Sold by
Christensen Don L
Bought by
Dlmsc Ltd Partnership
Create a Home Valuation Report for This Property
The Home Valuation Report is an in-depth analysis detailing your home's value as well as a comparison with similar homes in the area
Home Values in the Area
Average Home Value in this Area
Purchase History
| Date | Buyer | Sale Price | Title Company |
|---|---|---|---|
| Christensen Jed Edward | -- | Us Title | |
| Dlmsc Llc | -- | None Available | |
| Dmc Holdings | -- | -- | |
| Christensen Don L | -- | -- | |
| Dmc Holdings | -- | -- | |
| Dlmsc Ltd Partnership | -- | -- | |
| Christensen Don L | -- | -- | |
| Dlmsc Ltd Partnership | -- | -- |
Source: Public Records
Tax History Compared to Growth
Tax History
| Year | Tax Paid | Tax Assessment Tax Assessment Total Assessment is a certain percentage of the fair market value that is determined by local assessors to be the total taxable value of land and additions on the property. | Land | Improvement |
|---|---|---|---|---|
| 2025 | $932 | $490,540 | $409,350 | $81,190 |
| 2024 | $1,360 | $383,821 | $300,685 | $83,136 |
| 2023 | $5,165 | $336,600 | $274,158 | $62,441 |
| 2022 | $5,052 | $610,000 | $522,188 | $87,812 |
| 2021 | $860 | $462,377 | $432,791 | $29,586 |
| 2020 | $3,912 | $375,000 | $345,414 | $29,586 |
| 2019 | $3,851 | $364,000 | $288,960 | $75,040 |
| 2018 | $3,434 | $316,000 | $260,441 | $55,559 |
| 2016 | $2,991 | $195,938 | $179,316 | $16,622 |
| 2015 | $3,065 | $191,703 | $179,316 | $12,387 |
| 2014 | $2,369 | $156,819 | $152,419 | $4,400 |
| 2013 | -- | $139,629 | $87,711 | $51,918 |
Source: Public Records
Map
Nearby Homes
- 825 W 1320 N
- 1084 W Audrey Ln Unit 20
- 1084 W Audrey Ln
- 789 W 1950 N
- 1520 N 550 W
- 2035 N 800 W
- 988 W 1950 N Unit 134
- Hampton Traditional Plan at Belmont Farms
- 2257 N 830 W
- 366 W 1000 N
- 580 W 2125 N
- 790 N 500 W
- 1503 N 300 W
- 2339 N 800 W
- 767 W 220 N
- 235 W 1400 N
- 280 N 1100 W
- 1410 N 200 W
- 239 Lyman Ln
- 340 N 500 W Unit 204