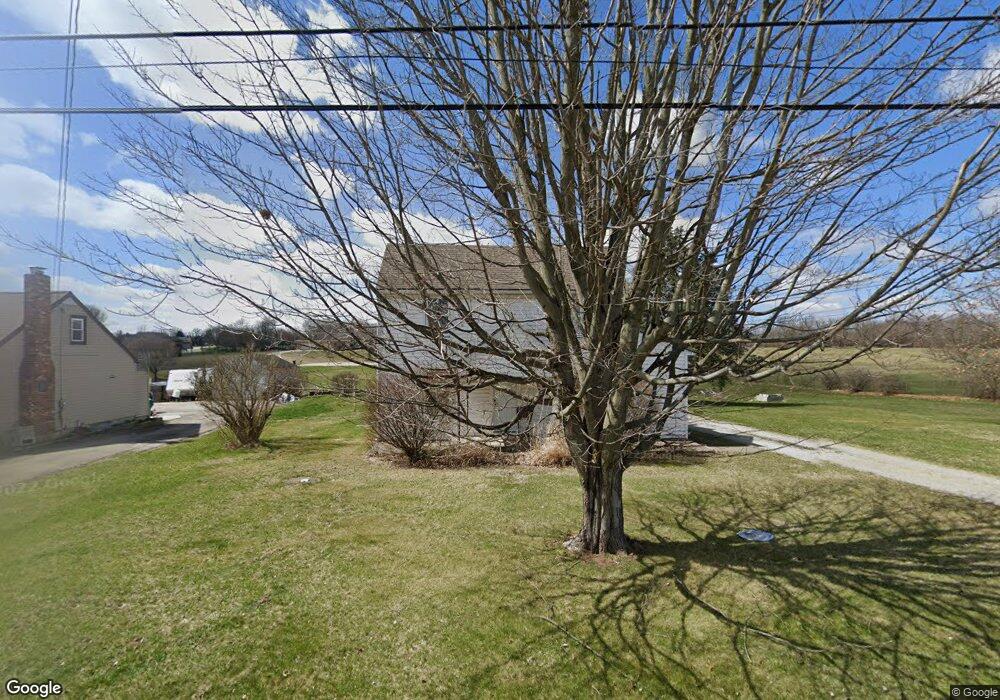
1347 S Bird Rd Springfield, OH 45505
Estimated Value: $193,000 - $239,000
3
Beds
1
Bath
1,410
Sq Ft
$151/Sq Ft
Est. Value
About This Home
This home is located at 1347 S Bird Rd, Springfield, OH 45505 and is currently estimated at $212,533, approximately $150 per square foot. 1347 S Bird Rd is a home located in Clark County with nearby schools including Possum Elementary School, Shawnee Middle School/High School, and Twin Oaks Sda Elementary School.
Ownership History
Date
Name
Owned For
Owner Type
Purchase Details
Closed on
Aug 28, 2015
Sold by
Secretary Of Hud
Bought by
Baughman Cody Lee
Current Estimated Value
Home Financials for this Owner
Home Financials are based on the most recent Mortgage that was taken out on this home.
Original Mortgage
$71,974
Outstanding Balance
$56,180
Interest Rate
3.97%
Mortgage Type
New Conventional
Estimated Equity
$156,353
Purchase Details
Closed on
Dec 30, 2014
Sold by
Bank Of America Na
Bought by
Secretary Of Hud
Purchase Details
Closed on
Dec 4, 2014
Sold by
Mcintosh Christina C
Bought by
Bank Of America Na and Bac Home Loans Serviving Lp
Purchase Details
Closed on
Jun 14, 2006
Sold by
Mcintosh Christina C and Mcintosh Lynn
Bought by
Mcintosh Christina C
Home Financials for this Owner
Home Financials are based on the most recent Mortgage that was taken out on this home.
Original Mortgage
$111,500
Interest Rate
6.73%
Mortgage Type
New Conventional
Create a Home Valuation Report for This Property
The Home Valuation Report is an in-depth analysis detailing your home's value as well as a comparison with similar homes in the area
Home Values in the Area
Average Home Value in this Area
Purchase History
| Date | Buyer | Sale Price | Title Company |
|---|---|---|---|
| Baughman Cody Lee | $74,200 | Chicago Title Co Llc | |
| Secretary Of Hud | -- | None Available | |
| Bank Of America Na | $95,000 | Attorney | |
| Mcintosh Christina C | -- | None Available |
Source: Public Records
Mortgage History
| Date | Status | Borrower | Loan Amount |
|---|---|---|---|
| Open | Baughman Cody Lee | $71,974 | |
| Previous Owner | Mcintosh Christina C | $111,500 |
Source: Public Records
Tax History
| Year | Tax Paid | Tax Assessment Tax Assessment Total Assessment is a certain percentage of the fair market value that is determined by local assessors to be the total taxable value of land and additions on the property. | Land | Improvement |
|---|---|---|---|---|
| 2025 | $2,328 | $57,670 | $20,240 | $37,430 |
| 2024 | $2,269 | $45,460 | $14,650 | $30,810 |
| 2023 | $2,269 | $45,460 | $14,650 | $30,810 |
| 2022 | $2,251 | $45,460 | $14,650 | $30,810 |
| 2021 | $1,964 | $35,510 | $11,360 | $24,150 |
| 2020 | $1,980 | $35,510 | $11,360 | $24,150 |
| 2019 | $2,011 | $35,510 | $11,360 | $24,150 |
| 2018 | $1,877 | $32,670 | $10,330 | $22,340 |
| 2017 | $1,923 | $32,662 | $10,325 | $22,337 |
| 2016 | $1,739 | $32,662 | $10,325 | $22,337 |
| 2015 | $1,756 | $31,892 | $10,325 | $21,567 |
| 2014 | $1,761 | $31,892 | $10,325 | $21,567 |
| 2013 | $1,536 | $31,892 | $10,325 | $21,567 |
Source: Public Records
Map
Nearby Homes
- 2076 Stowe Dr
- 2076-2078 Stowe Dr
- 3129 E High St
- 2809 Morton Dr
- 3154 Sherwood Park Dr
- 224 Roebling St
- 224 Mackinac Dr
- 1011 Mount Joy St
- 255 S Bird Rd
- 216 Skyway Dr
- 451 Lawnview Ave
- 218 Golden Gate Ave
- 2804 Lowman St
- 3012 E High St
- 2560 Kenton St
- 169 Chesapeake Cir
- 138 Lawnview Ave
- 2164 Ridge Rd
- 2212 Ridge Rd
- 4012 Altman Ave
- 1351 S Bird Rd
- 1362 Woodbridge Ln
- 3535 Saybrook Dr Unit 21
- 3535 Saybrook Rd
- 1365 Woodbridge Ln
- 3460 Saybrook Rd
- 3495 Saybrook Rd
- 1356 Darien Ln
- 3461 Saybrook Rd
- 1380 Darien Ln
- 1233 S Bird Rd
- 1402 Darien Ln
- 1225 S Bird Rd
- 1343 Darien Ln
- 1211 S Bird Rd
- 1363 Darien Ln
- 3479 Eichelberger Ln
- 3396 Saybrook Rd
- 3405 Saybrook Rd
- 1201 S Bird Rd
Your Personal Tour Guide
Ask me questions while you tour the home.