1348 S 700 W Anderson, IN 46011
Estimated Value: $314,821 - $325,000
3
Beds
1
Bath
1,926
Sq Ft
$166/Sq Ft
Est. Value
About This Home
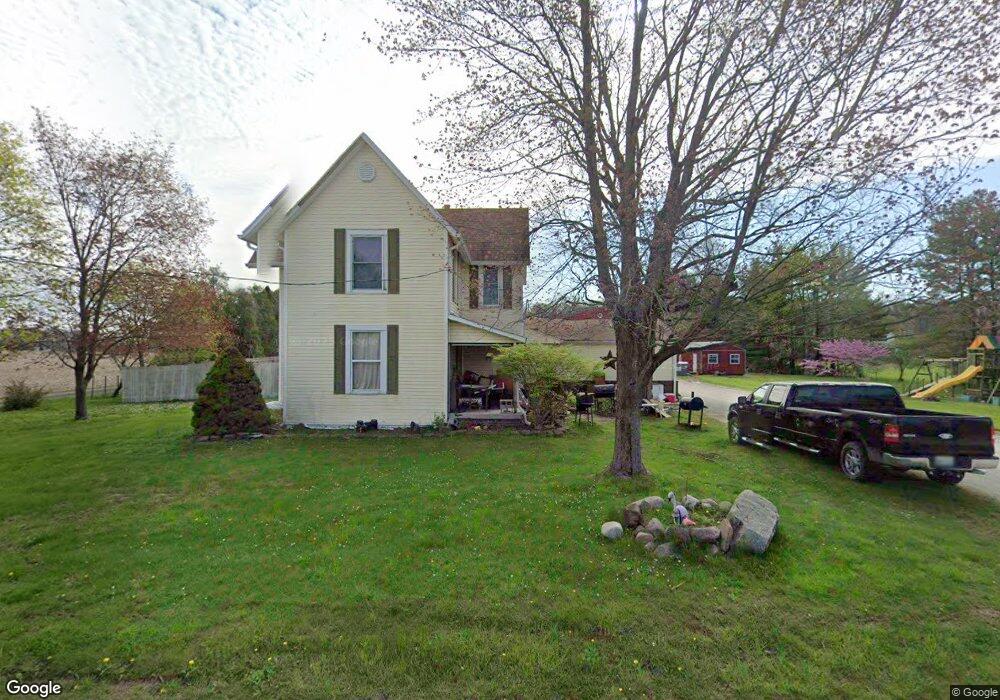
This home is located at 1348 S 700 W, Anderson, IN 46011 and is currently estimated at $319,911, approximately $166 per square foot. 1348 S 700 W is a home located in Madison County with nearby schools including Lapel Elementary School, Lapel Middle School, and Lapel Senior High School.
Ownership History
Date
Name
Owned For
Owner Type
Purchase Details
Closed on
Aug 28, 2009
Sold by
Wall Cary W and Wall Lorraine M
Bought by
Bluhm Paula A
Current Estimated Value
Home Financials for this Owner
Home Financials are based on the most recent Mortgage that was taken out on this home.
Original Mortgage
$80,500
Interest Rate
5.27%
Mortgage Type
New Conventional
Purchase Details
Closed on
Aug 25, 2009
Sold by
Bluhm Paul A
Bought by
Guenther Jeffrey R
Home Financials for this Owner
Home Financials are based on the most recent Mortgage that was taken out on this home.
Original Mortgage
$80,500
Interest Rate
5.27%
Mortgage Type
New Conventional
Create a Home Valuation Report for This Property
The Home Valuation Report is an in-depth analysis detailing your home's value as well as a comparison with similar homes in the area
Home Values in the Area
Average Home Value in this Area
Purchase History
| Date | Buyer | Sale Price | Title Company |
|---|---|---|---|
| Bluhm Paula A | -- | -- | |
| Guenther Jeffrey R | -- | -- |
Source: Public Records
Mortgage History
| Date | Status | Borrower | Loan Amount |
|---|---|---|---|
| Previous Owner | Guenther Jeffrey R | $80,500 |
Source: Public Records
Tax History Compared to Growth
Tax History
| Year | Tax Paid | Tax Assessment Tax Assessment Total Assessment is a certain percentage of the fair market value that is determined by local assessors to be the total taxable value of land and additions on the property. | Land | Improvement |
|---|---|---|---|---|
| 2024 | $3,818 | $190,900 | $30,200 | $160,700 |
| 2023 | $3,888 | $180,200 | $28,200 | $152,000 |
| 2022 | $3,850 | $175,400 | $26,100 | $149,300 |
| 2021 | $3,503 | $160,100 | $25,600 | $134,500 |
| 2020 | $3,442 | $152,300 | $24,500 | $127,800 |
| 2019 | $2,193 | $108,600 | $25,200 | $83,400 |
| 2018 | $2,043 | $100,800 | $25,300 | $75,500 |
| 2017 | $1,852 | $91,600 | $23,000 | $68,600 |
| 2016 | $1,855 | $91,800 | $23,200 | $68,600 |
| 2014 | $1,901 | $92,700 | $23,400 | $69,300 |
| 2013 | $1,901 | $89,300 | $22,900 | $66,400 |
Source: Public Records
Map
Nearby Homes
- 0 W 300 S Unit MBR22051203
- 5668 W 250 S
- 610 Tuscany Trail
- 0 Vine St
- Aspen II Plan at Tuscany
- Ironwood Plan at Tuscany
- Spruce Plan at Tuscany
- Ashton Plan at Tuscany
- Cooper Plan at Tuscany
- Bradford Plan at Tuscany
- Palmetto Plan at Tuscany
- Chestnut Plan at Tuscany
- Norway Plan at Tuscany
- Empress Plan at Tuscany
- Juniper Plan at Tuscany
- 1019 N John St
- 615 Tuscany Trail
- 1309 Woodward St
- 4896 W State Road 32
- 614 S Woodward St