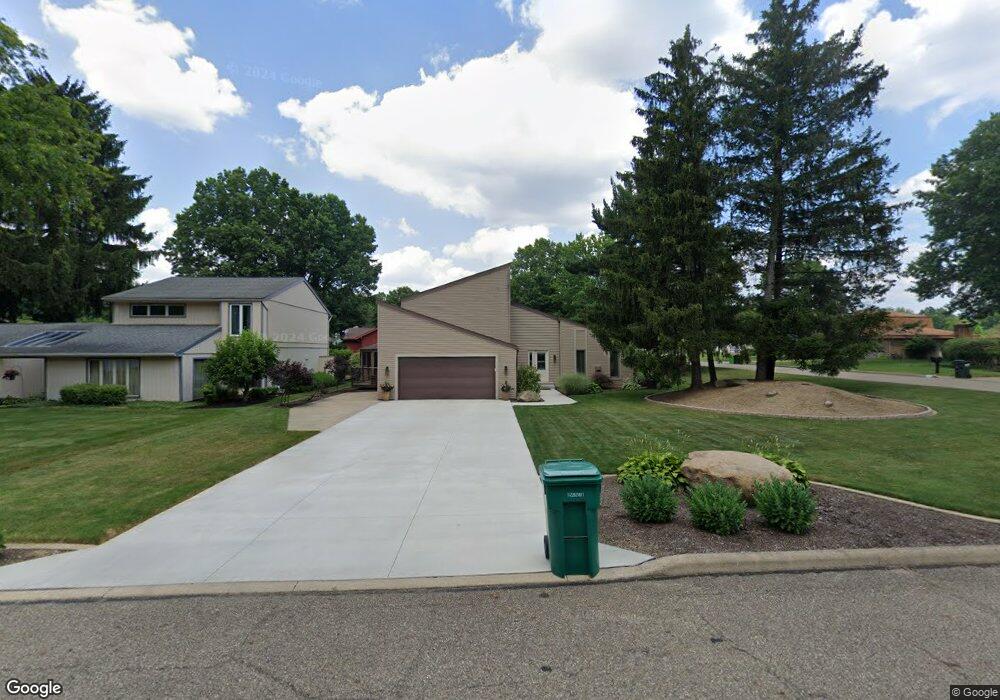
1348 Springhaven Cir NE Massillon, OH 44646
Amherst Heights-Clearview NeighborhoodEstimated Value: $301,426 - $345,000
4
Beds
3
Baths
2,478
Sq Ft
$132/Sq Ft
Est. Value
About This Home
This home is located at 1348 Springhaven Cir NE, Massillon, OH 44646 and is currently estimated at $328,107, approximately $132 per square foot. 1348 Springhaven Cir NE is a home located in Stark County with nearby schools including Massillon Intermediate School, Massillon Junior High School, and Washington High School.
Ownership History
Date
Name
Owned For
Owner Type
Purchase Details
Closed on
Apr 24, 2014
Sold by
Hoosic Paul T and Hoosic Marcia
Bought by
Goodnight Mark J
Current Estimated Value
Home Financials for this Owner
Home Financials are based on the most recent Mortgage that was taken out on this home.
Original Mortgage
$133,600
Outstanding Balance
$101,828
Interest Rate
4.41%
Mortgage Type
New Conventional
Estimated Equity
$226,279
Purchase Details
Closed on
Sep 23, 2003
Sold by
Hoosic Paul T
Bought by
Hoosic Paul T and Hoosic Marcia
Home Financials for this Owner
Home Financials are based on the most recent Mortgage that was taken out on this home.
Original Mortgage
$124,000
Interest Rate
6.33%
Mortgage Type
Purchase Money Mortgage
Purchase Details
Closed on
Mar 15, 1991
Create a Home Valuation Report for This Property
The Home Valuation Report is an in-depth analysis detailing your home's value as well as a comparison with similar homes in the area
Home Values in the Area
Average Home Value in this Area
Purchase History
| Date | Buyer | Sale Price | Title Company |
|---|---|---|---|
| Goodnight Mark J | $167,000 | None Available | |
| Hoosic Paul T | -- | Cardinal Title Company | |
| -- | $95,200 | -- |
Source: Public Records
Mortgage History
| Date | Status | Borrower | Loan Amount |
|---|---|---|---|
| Open | Goodnight Mark J | $133,600 | |
| Previous Owner | Hoosic Paul T | $124,000 |
Source: Public Records
Tax History Compared to Growth
Tax History
| Year | Tax Paid | Tax Assessment Tax Assessment Total Assessment is a certain percentage of the fair market value that is determined by local assessors to be the total taxable value of land and additions on the property. | Land | Improvement |
|---|---|---|---|---|
| 2025 | -- | $89,950 | $20,930 | $69,020 |
| 2024 | -- | $89,950 | $20,930 | $69,020 |
| 2023 | $3,835 | $75,010 | $19,530 | $55,480 |
| 2022 | $3,837 | $75,010 | $19,530 | $55,480 |
| 2021 | $3,899 | $75,010 | $19,530 | $55,480 |
| 2020 | $3,430 | $62,090 | $16,870 | $45,220 |
| 2019 | $3,381 | $62,100 | $16,870 | $45,230 |
| 2018 | $3,362 | $62,100 | $16,870 | $45,230 |
| 2017 | $3,217 | $55,520 | $16,420 | $39,100 |
| 2016 | $3,272 | $55,520 | $16,420 | $39,100 |
| 2015 | $3,231 | $55,520 | $16,420 | $39,100 |
| 2014 | $1,355 | $54,190 | $16,000 | $38,190 |
| 2013 | $1,518 | $48,830 | $16,000 | $32,830 |
Source: Public Records
Map
Nearby Homes
- 1717 Chittenden Cir NE
- 1209 Providence Rd NE
- 1744 Oak Trail St NE
- 1659 Dexter Rd NE
- 1204 Taggart St NW
- 932 Wales Rd NE
- 2107 Via Luna Cir NE
- 1056 Taggart St NW
- 742 Sheffield Ave NE
- Caicos Plan at Tuscany Park
- 819 Irvington Ave NE
- 365 Hamilton Ave NE
- 906 17th St NE
- 1635 Jolynn St NE
- 888 Seneca St NE
- 1267 Plymouth St NW
- 739 Vogel Ave NE
- 1706 Jefferson Rd NE
- 2919 Inwood Dr NW
- 0 Wildridge Rd NW Unit 36853475
- 1340 Springhaven Cir NE
- 1406 Springhaven Cir NE
- 1332 Springhaven Cir NE
- 1351 Springhaven Cir NE
- 1725 Chittenden Cir NE
- 1720 Chittenden Cir NE
- 1414 Springhaven Cir NE
- 1324 Springhaven Cir NE
- 1407 Springhaven Cir NE
- 1335 Springhaven Cir NE
- 1327 Springhaven Cir NE
- 1728 Chittenden Cir NE
- 1316 Springhaven Cir NE
- 1415 Springhaven Cir NE
- 1422 Springhaven Cir NE
- 1733 Chittenden Cir NE
- 1726 Wales Rd NE
- 1736 Chittenden Cir NE
- 1734 Wales Rd NE
- 1703 Springhaven Cir NE