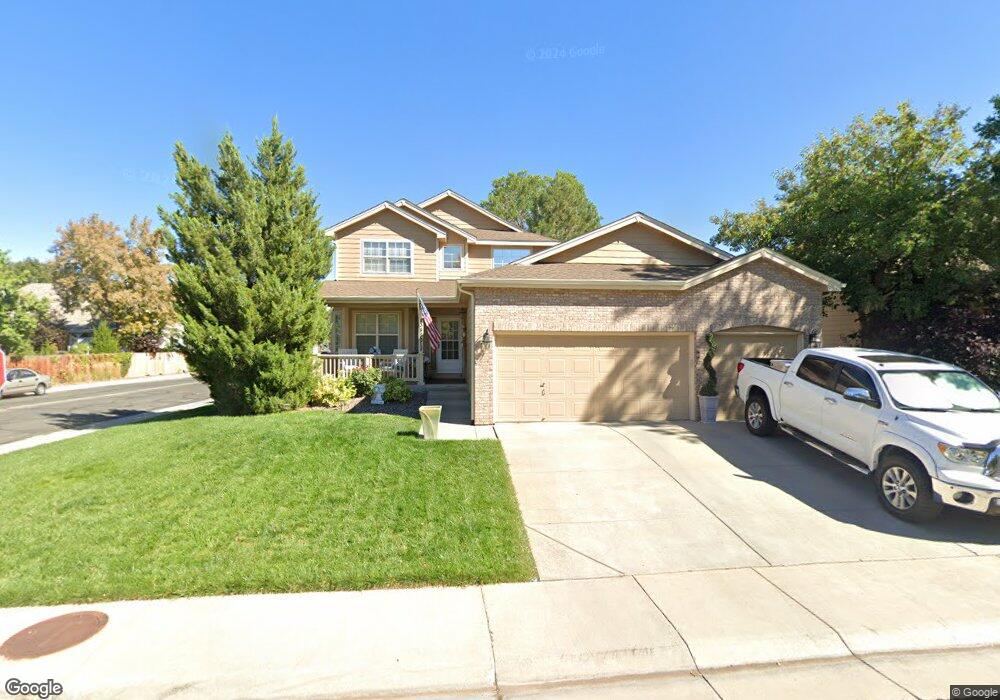
13480 Fillmore Ct Thornton, CO 80241
Signal Creek NeighborhoodEstimated Value: $593,000 - $669,000
3
Beds
3
Baths
2,404
Sq Ft
$258/Sq Ft
Est. Value
About This Home
This home is located at 13480 Fillmore Ct, Thornton, CO 80241 and is currently estimated at $619,066, approximately $257 per square foot. 13480 Fillmore Ct is a home located in Adams County with nearby schools including Tarver Elementary School, Century Middle School, and Horizon High School.
Ownership History
Date
Name
Owned For
Owner Type
Purchase Details
Closed on
Mar 18, 2015
Sold by
Harper Maynard L
Bought by
Harper Maynard L and Harper Nancy J
Current Estimated Value
Purchase Details
Closed on
Oct 7, 2010
Sold by
Harper Nancy J and Harper Maynard L
Bought by
Harper Maynard L
Home Financials for this Owner
Home Financials are based on the most recent Mortgage that was taken out on this home.
Original Mortgage
$279,226
Outstanding Balance
$184,447
Interest Rate
4.37%
Mortgage Type
FHA
Estimated Equity
$434,619
Purchase Details
Closed on
Jun 26, 1995
Sold by
Village Homes Of Colorado Inc
Bought by
Harper Maynard L and Harper Nancy J
Home Financials for this Owner
Home Financials are based on the most recent Mortgage that was taken out on this home.
Original Mortgage
$162,350
Interest Rate
7.77%
Create a Home Valuation Report for This Property
The Home Valuation Report is an in-depth analysis detailing your home's value as well as a comparison with similar homes in the area
Home Values in the Area
Average Home Value in this Area
Purchase History
| Date | Buyer | Sale Price | Title Company |
|---|---|---|---|
| Harper Maynard L | -- | None Available | |
| Harper Maynard L | -- | None Available | |
| Harper Maynard L | $180,736 | Land Title |
Source: Public Records
Mortgage History
| Date | Status | Borrower | Loan Amount |
|---|---|---|---|
| Open | Harper Maynard L | $279,226 | |
| Closed | Harper Maynard L | $162,350 |
Source: Public Records
Tax History Compared to Growth
Tax History
| Year | Tax Paid | Tax Assessment Tax Assessment Total Assessment is a certain percentage of the fair market value that is determined by local assessors to be the total taxable value of land and additions on the property. | Land | Improvement |
|---|---|---|---|---|
| 2024 | $3,263 | $36,130 | $8,130 | $28,000 |
| 2023 | $3,230 | $42,010 | $8,390 | $33,620 |
| 2022 | $2,689 | $31,360 | $8,620 | $22,740 |
| 2021 | $2,779 | $31,360 | $8,620 | $22,740 |
| 2020 | $2,606 | $30,510 | $8,870 | $21,640 |
| 2019 | $3,411 | $30,510 | $8,870 | $21,640 |
| 2018 | $3,330 | $28,940 | $7,200 | $21,740 |
| 2017 | $3,028 | $28,940 | $7,200 | $21,740 |
| 2016 | $2,717 | $25,280 | $5,890 | $19,390 |
| 2015 | $2,713 | $25,280 | $5,890 | $19,390 |
| 2014 | $2,580 | $23,370 | $5,410 | $17,960 |
Source: Public Records
Map
Nearby Homes
- 13540 Detroit St
- 2788 E 132nd Cir
- 2691 E 132nd Ave
- 2746 E 132nd Place
- 2883 E 136th Place
- 3022 E 137th Place
- 13080 Harrison Dr
- 4061 E 133rd Cir
- 13068 Harrison Dr
- 13606 Garfield St Unit E
- 12814 Jackson Cir
- 13758 Cook St
- 13638 Garfield St Unit B
- 13638 Garfield St Unit C
- 0 Colorado Blvd
- 2275 E 129th Ave
- 3850 E 128th Way
- 13398 Race St
- 12811 Josephine Ct
- 13346 Birch Cir
- 13460 Fillmore Ct
- 13485 Milwaukee Ct
- 13500 Fillmore Ct
- 13440 Fillmore Ct
- 13465 Milwaukee Ct
- 13485 Fillmore Ct
- 13445 Milwaukee Ct
- 13420 Fillmore Ct
- 13465 Fillmore Ct
- 13504 Fillmore Ct
- 13514 Detroit St
- 13445 Fillmore Ct
- 13525 Milwaukee Ct
- 13425 Milwaukee Ct
- 13400 Fillmore Ct
- 13425 Fillmore Ct
- 13508 Fillmore Ct
- 13518 Detroit St
- 13460 Milwaukee Ct
- 13480 Detroit Ct