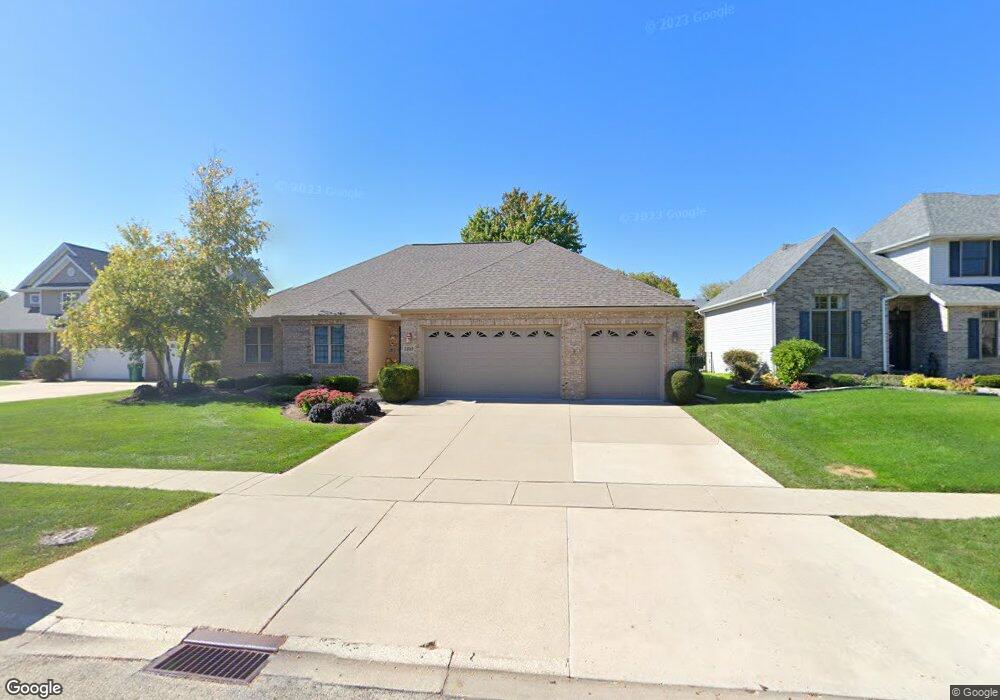
1349 Axcel Ln Sycamore, IL 60178
Estimated Value: $395,000 - $485,000
4
Beds
2
Baths
2,036
Sq Ft
$209/Sq Ft
Est. Value
About This Home
This home is located at 1349 Axcel Ln, Sycamore, IL 60178 and is currently estimated at $425,173, approximately $208 per square foot. 1349 Axcel Ln is a home located in DeKalb County with nearby schools including Sycamore High School, Cornerstone Christian Academy, and St Mary's Catholic School.
Create a Home Valuation Report for This Property
The Home Valuation Report is an in-depth analysis detailing your home's value as well as a comparison with similar homes in the area
Home Values in the Area
Average Home Value in this Area
Tax History Compared to Growth
Tax History
| Year | Tax Paid | Tax Assessment Tax Assessment Total Assessment is a certain percentage of the fair market value that is determined by local assessors to be the total taxable value of land and additions on the property. | Land | Improvement |
|---|---|---|---|---|
| 2024 | $9,474 | $126,738 | $18,682 | $108,056 |
| 2023 | $9,474 | $115,732 | $17,060 | $98,672 |
| 2022 | $9,017 | $106,147 | $15,647 | $90,500 |
| 2021 | $8,553 | $99,650 | $14,689 | $84,961 |
| 2020 | $8,422 | $97,201 | $14,328 | $82,873 |
| 2019 | $8,275 | $95,071 | $14,014 | $81,057 |
| 2018 | $8,118 | $92,186 | $13,589 | $78,597 |
| 2017 | $7,898 | $88,538 | $13,051 | $75,487 |
| 2016 | $7,683 | $84,499 | $12,456 | $72,043 |
| 2015 | -- | $79,528 | $11,723 | $67,805 |
| 2014 | -- | $75,518 | $11,132 | $64,386 |
| 2013 | -- | $76,965 | $11,345 | $65,620 |
Source: Public Records
Map
Nearby Homes
- 1308 Axcel Ln
- 700 Susan St
- Rt 23 and Plank Rd Rt 23 and Plank Rd Rd
- 24 Kloe Ln Unit 24
- 68 Kloe Ln Unit 68
- 1435 Beach Ln
- 335 North Ave
- Lot43 Heron Creek Es Letha Westgate Dr
- 1360 Florence Dr
- 740 W State St
- 639 Stonegate Dr
- 585 Clayton Cir Unit C
- 1936 Galloway Ct
- 1929 Galloway Ct
- 60 Kloe Ln Unit 60
- 64 Kloe Ln Unit 64
- 44 Kloe Ln Unit 44
- 45 Briden Ln Unit 45
- Lot 97 Merry Oaks Dr
- Lot 86 Merry Oaks Dr