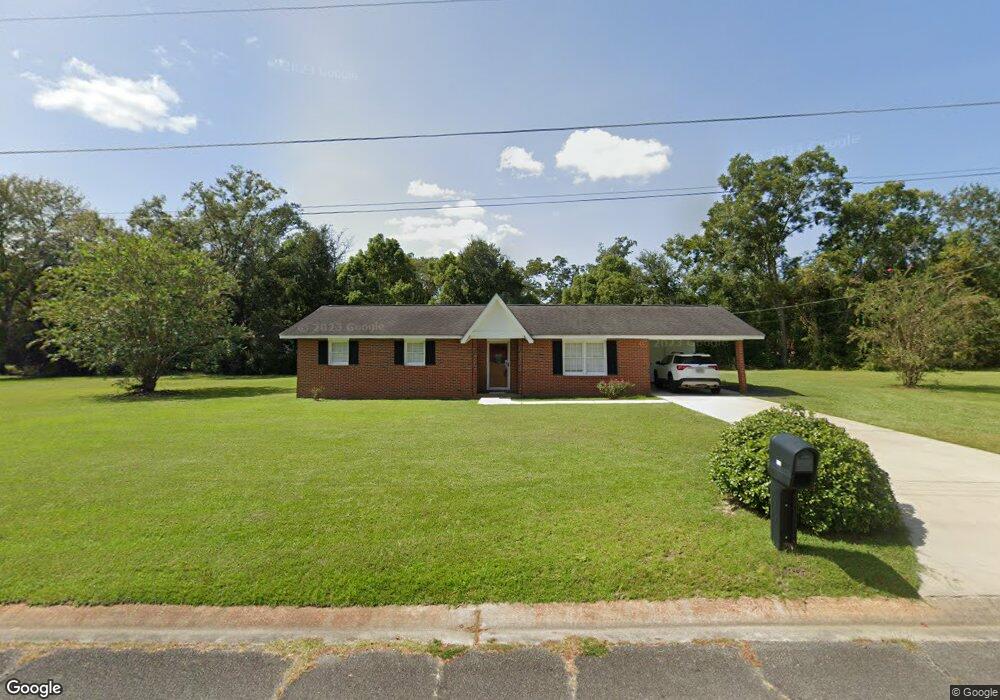
1349 Hendrix Dr Waycross, GA 31503
Estimated Value: $169,760 - $214,000
3
Beds
2
Baths
1,230
Sq Ft
$157/Sq Ft
Est. Value
About This Home
This home is located at 1349 Hendrix Dr, Waycross, GA 31503 and is currently estimated at $192,940, approximately $156 per square foot. 1349 Hendrix Dr is a home located in Ware County with nearby schools including Waresboro Elementary School, Ware County Middle School, and Ware County High School.
Ownership History
Date
Name
Owned For
Owner Type
Purchase Details
Closed on
Jul 22, 2020
Sold by
Bartram Ryan D
Bought by
Rodriguez Nancy Tinajero
Current Estimated Value
Home Financials for this Owner
Home Financials are based on the most recent Mortgage that was taken out on this home.
Original Mortgage
$112,917
Outstanding Balance
$100,127
Interest Rate
3.1%
Mortgage Type
FHA
Estimated Equity
$92,813
Purchase Details
Closed on
Sep 13, 2013
Sold by
Bartrum Ryan D
Bought by
Bartram Ryan D and Bartram Katie Elizabeth
Home Financials for this Owner
Home Financials are based on the most recent Mortgage that was taken out on this home.
Original Mortgage
$71,428
Interest Rate
4.39%
Mortgage Type
New Conventional
Purchase Details
Closed on
Jul 1, 2013
Sold by
Ranew Leslie Beard
Bought by
Brown Peggie Hill Eard
Home Financials for this Owner
Home Financials are based on the most recent Mortgage that was taken out on this home.
Original Mortgage
$71,428
Interest Rate
4.39%
Mortgage Type
New Conventional
Create a Home Valuation Report for This Property
The Home Valuation Report is an in-depth analysis detailing your home's value as well as a comparison with similar homes in the area
Home Values in the Area
Average Home Value in this Area
Purchase History
| Date | Buyer | Sale Price | Title Company |
|---|---|---|---|
| Rodriguez Nancy Tinajero | $115,000 | -- | |
| Bartram Ryan D | -- | -- | |
| Bartrum Ryan D | $70,000 | -- | |
| Brown Peggie Hill Eard | -- | -- |
Source: Public Records
Mortgage History
| Date | Status | Borrower | Loan Amount |
|---|---|---|---|
| Open | Rodriguez Nancy Tinajero | $112,917 | |
| Previous Owner | Bartrum Ryan D | $71,428 | |
| Previous Owner | Brown Peggie Hill Eard | $71,428 |
Source: Public Records
Tax History Compared to Growth
Tax History
| Year | Tax Paid | Tax Assessment Tax Assessment Total Assessment is a certain percentage of the fair market value that is determined by local assessors to be the total taxable value of land and additions on the property. | Land | Improvement |
|---|---|---|---|---|
| 2024 | $1,559 | $61,782 | $10,080 | $51,702 |
| 2023 | $1,590 | $39,004 | $3,696 | $35,308 |
| 2022 | $1,126 | $39,004 | $3,696 | $35,308 |
| 2021 | $994 | $31,692 | $3,696 | $27,996 |
| 2020 | $975 | $30,740 | $3,696 | $27,044 |
| 2019 | $803 | $24,833 | $3,696 | $21,137 |
| 2018 | $779 | $23,857 | $3,696 | $20,161 |
| 2017 | $778 | $23,857 | $3,696 | $20,161 |
| 2016 | $778 | $23,857 | $3,696 | $20,161 |
| 2015 | $785 | $23,857 | $3,696 | $20,161 |
| 2014 | $784 | $23,857 | $3,696 | $20,161 |
| 2013 | -- | $23,857 | $3,696 | $20,161 |
Source: Public Records
Map
Nearby Homes
- 1238 Red Keen Rd
- 2836 Evergreen Rd
- 2867 Evergreen Rd
- 2885 Longwood Rd
- 850 Woodard Ln
- 1261 Lake St
- 2857 Cherokee St
- 1210 N Augusta Ave
- Lot 155 N Augusta Avenue Cherokee Ave
- 2117 Tamara Rd
- 1300 Stanton Ave
- 2066 Cherokee St
- 0 Anita South St
- 2869 Ben St
- 2879 Ben St
- 1953 State St
- 2885 Ben St
- 221 Sierra Ln
- 1601 Genoa St
- 274 S Anita St
- 1355 Hendrix Dr
- 1311 Hendrix Dr
- 1354 Hendrix Dr
- 2534 Lamar Avenue Extension
- 1360 Hendrix Dr
- 1342 Red Keen Rd
- 2521 Josephine Ln
- 1372 Red Keen Rd
- 1288 Lark St
- 2502 Hampton Cir
- 1286 Red Keen Rd
- 2533 Lamar Avenue Extension
- 2513 Josephine Ln
- 2600 Lamar Avenue Extension
- 1400 Red Keen Rd
- 2527 Josephine Ln
- 2568 Ben Hill Ave
- 2578 Ben Hill Ave
- 2503 Josephine Ln
- 2550 Ben Hill Ave