Estimated Value: $335,412 - $362,000
3
Beds
2
Baths
1,822
Sq Ft
$190/Sq Ft
Est. Value
About This Home
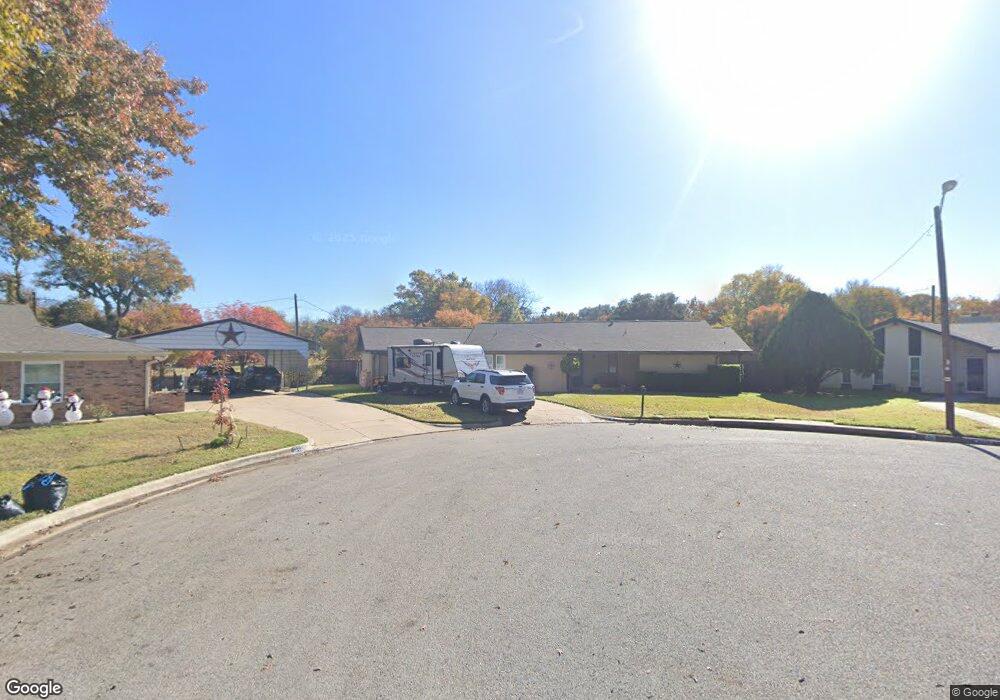
This home is located at 1349 Kathryn Ct, Hurst, TX 76053 and is currently estimated at $346,103, approximately $189 per square foot. 1349 Kathryn Ct is a home located in Tarrant County with nearby schools including Jack C Binion Elementary School, Richland Middle School, and Birdville High School.
Ownership History
Date
Name
Owned For
Owner Type
Purchase Details
Closed on
Dec 21, 2017
Sold by
Cookson Denise S and Foster Denise S
Bought by
Cookson Denise S and Cooksonq Leland Alan
Current Estimated Value
Purchase Details
Closed on
Apr 21, 2008
Sold by
Cross Sheila A and Cross Randy
Bought by
Foster Denise S
Home Financials for this Owner
Home Financials are based on the most recent Mortgage that was taken out on this home.
Original Mortgage
$110,500
Outstanding Balance
$69,521
Interest Rate
5.84%
Mortgage Type
Purchase Money Mortgage
Estimated Equity
$276,582
Purchase Details
Closed on
Feb 20, 2007
Sold by
Parris Lloyd G and Parris Joyce
Bought by
Cross Randy and Cross Sheila A
Home Financials for this Owner
Home Financials are based on the most recent Mortgage that was taken out on this home.
Original Mortgage
$95,200
Interest Rate
6.17%
Mortgage Type
Purchase Money Mortgage
Create a Home Valuation Report for This Property
The Home Valuation Report is an in-depth analysis detailing your home's value as well as a comparison with similar homes in the area
Home Values in the Area
Average Home Value in this Area
Purchase History
| Date | Buyer | Sale Price | Title Company |
|---|---|---|---|
| Cookson Denise S | -- | None Available | |
| Foster Denise S | -- | Capital Title Of Tex | |
| Cross Randy | -- | Capital Title |
Source: Public Records
Mortgage History
| Date | Status | Borrower | Loan Amount |
|---|---|---|---|
| Open | Foster Denise S | $110,500 | |
| Previous Owner | Cross Randy | $95,200 |
Source: Public Records
Tax History Compared to Growth
Tax History
| Year | Tax Paid | Tax Assessment Tax Assessment Total Assessment is a certain percentage of the fair market value that is determined by local assessors to be the total taxable value of land and additions on the property. | Land | Improvement |
|---|---|---|---|---|
| 2025 | $3,802 | $240,723 | $57,173 | $183,550 |
| 2024 | $3,802 | $240,723 | $57,173 | $183,550 |
| 2023 | $5,071 | $248,369 | $47,438 | $200,931 |
| 2022 | $4,987 | $219,427 | $47,388 | $172,039 |
| 2021 | $4,757 | $183,378 | $29,750 | $153,628 |
| 2020 | $5,256 | $204,520 | $29,750 | $174,770 |
| 2019 | $5,103 | $212,439 | $27,500 | $184,939 |
| 2018 | $4,071 | $176,491 | $13,750 | $162,741 |
| 2017 | $4,281 | $179,796 | $17,500 | $162,296 |
| 2016 | $3,892 | $171,105 | $17,500 | $153,605 |
| 2015 | $3,181 | $132,600 | $14,000 | $118,600 |
| 2014 | $3,181 | $132,600 | $14,000 | $118,600 |
Source: Public Records
Map
Nearby Homes
- 1361 Kathryn Ct
- 1304 W Redbud Dr
- 228 Arcadia St
- 632 Melbourne Ct
- 1200 Walker Dr
- 7601 Kevin Dr
- 405 Billy Creek Cir
- 3629 Landy Ln
- 4209 Ashmore Dr
- 512 Billie Ruth Ln
- 1112 Blakey Ct
- 4304 Lynn Terrace
- 649 Timberline Dr
- 7801 Conn Dr
- 3712 Scranton Dr
- 8105 Winter Falls Trail
- 8308 Fall Crest Dr
- 913 Zelda Dr
- 8129 Trinity Vista Trail
- 1000 Madrid St
- 1353 Kathryn Ct
- 1345 Kathryn Ct
- 1341 Kathryn Ct
- 416 Sheppard Ct
- 1357 Kathryn Ct
- 417 Sheppard Ct
- 1365 Kathryn Ct
- 1337 W Redbud Dr
- 1333 W Redbud Dr
- 424 Glenn Dr
- 413 Sheppard Ct
- 1369 Kathryn Ct
- 412 Sheppard Ct
- 1329 W Redbud Dr
- 420 Glenn Dr
- 416 Glenn Dr
- 1325 W Redbud Dr
- 409 Sheppard Ct
- 408 Sheppard Ct
- 1336 W Redbud Dr