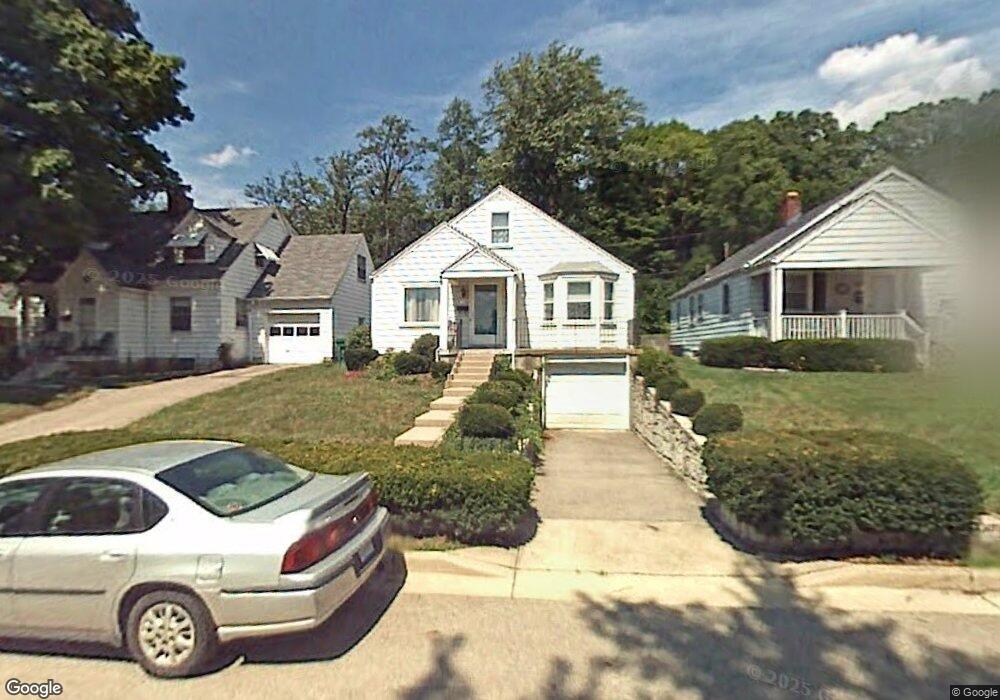
1349 Melrose Ave Dayton, OH 45409
Estimated Value: $203,000 - $232,000
4
Beds
3
Baths
1,327
Sq Ft
$162/Sq Ft
Est. Value
About This Home
This home is located at 1349 Melrose Ave, Dayton, OH 45409 and is currently estimated at $214,400, approximately $161 per square foot. 1349 Melrose Ave is a home located in Montgomery County with nearby schools including Southdale Elementary School, Van Buren Middle School, and Kettering Fairmont High School.
Ownership History
Date
Name
Owned For
Owner Type
Purchase Details
Closed on
Apr 21, 2020
Sold by
Newton Heather M and Heflin Heather M
Bought by
Witt Michael G and Witt Ashlynn N
Current Estimated Value
Home Financials for this Owner
Home Financials are based on the most recent Mortgage that was taken out on this home.
Original Mortgage
$148,200
Outstanding Balance
$131,038
Interest Rate
3.3%
Mortgage Type
New Conventional
Estimated Equity
$83,362
Purchase Details
Closed on
Jul 25, 2011
Sold by
Cash Jo Anne
Bought by
Heflin Heather M
Home Financials for this Owner
Home Financials are based on the most recent Mortgage that was taken out on this home.
Original Mortgage
$80,797
Interest Rate
4.62%
Mortgage Type
FHA
Purchase Details
Closed on
Feb 12, 2002
Sold by
Hedges Laurel T
Bought by
Hedges Helen R
Create a Home Valuation Report for This Property
The Home Valuation Report is an in-depth analysis detailing your home's value as well as a comparison with similar homes in the area
Home Values in the Area
Average Home Value in this Area
Purchase History
| Date | Buyer | Sale Price | Title Company |
|---|---|---|---|
| Witt Michael G | $149,333 | Sterling Land Title Agcy Inc | |
| Heflin Heather M | $82,900 | Attorney | |
| Hedges Helen R | -- | -- |
Source: Public Records
Mortgage History
| Date | Status | Borrower | Loan Amount |
|---|---|---|---|
| Open | Witt Michael G | $148,200 | |
| Closed | Heflin Heather M | $80,797 |
Source: Public Records
Tax History Compared to Growth
Tax History
| Year | Tax Paid | Tax Assessment Tax Assessment Total Assessment is a certain percentage of the fair market value that is determined by local assessors to be the total taxable value of land and additions on the property. | Land | Improvement |
|---|---|---|---|---|
| 2024 | $2,885 | $46,280 | $13,320 | $32,960 |
| 2023 | $2,885 | $46,280 | $13,320 | $32,960 |
| 2022 | $2,477 | $30,720 | $8,820 | $21,900 |
| 2021 | $2,245 | $30,720 | $8,820 | $21,900 |
| 2020 | $2,252 | $30,720 | $8,820 | $21,900 |
| 2019 | $2,530 | $30,560 | $8,820 | $21,740 |
| 2018 | $2,543 | $30,560 | $8,820 | $21,740 |
| 2017 | $2,344 | $30,560 | $8,820 | $21,740 |
| 2016 | $2,442 | $29,940 | $8,820 | $21,120 |
| 2015 | $2,334 | $29,940 | $8,820 | $21,120 |
| 2014 | $2,334 | $29,940 | $8,820 | $21,120 |
| 2012 | -- | $32,050 | $8,820 | $23,230 |
Source: Public Records
Map
Nearby Homes
- 1364 Elmdale Dr
- 1424 Elmdale Dr
- 1129 W Dorothy Ln
- 1545 Cardington Rd
- 1554 Crescent Blvd
- 1536 Old Lane Ave
- 1597 Old Lane Ave
- 3060 Regent St
- 1473 Constance Ave Unit 1481
- 3225 Southdale Dr Unit 1
- 1151 Brookview Ave
- 2467 S Dixie Dr
- 1314 Ridgeview Ave
- 1420 Adirondack Trail
- 1125 Laurelwood Rd
- 3464 Southern Blvd
- 1349 Tamerlane Rd
- 2230 S Patterson Blvd
- 1615 Carrollton Ave
- 1211 Runnymede Rd
- 1357 Melrose Ave
- 1341 Melrose Ave
- 1333 Melrose Ave
- 1381 Melrose Ave
- 1325 Melrose Ave
- 2804 Hilton Dr
- 1317 Melrose Ave
- 1348 Melrose Ave
- 1340 Melrose Ave
- 1372 Melrose Ave
- 1309 Melrose Ave
- 1332 Melrose Ave
- 1380 Melrose Ave
- 1324 Melrose Ave
- 1388 Melrose Ave
- 1316 Melrose Ave
- 1301 Melrose Ave
- 1308 Melrose Ave
- 1401 Melrose Ave
- 2805 Hilton Dr