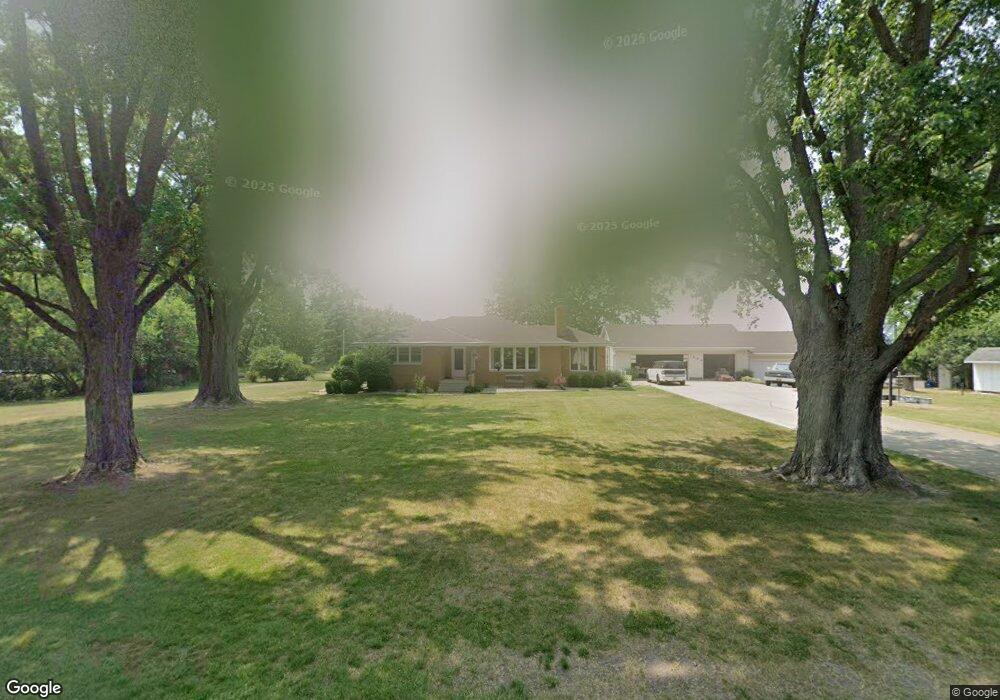
1349 N Queen Rd Walkerton, IN 46574
Estimated Value: $214,000 - $271,000
3
Beds
2
Baths
1,491
Sq Ft
$163/Sq Ft
Est. Value
About This Home
This home is located at 1349 N Queen Rd, Walkerton, IN 46574 and is currently estimated at $243,479, approximately $163 per square foot. 1349 N Queen Rd is a home located in Marshall County with nearby schools including John Glenn High School.
Ownership History
Date
Name
Owned For
Owner Type
Purchase Details
Closed on
Oct 15, 2024
Sold by
Keck Robbie and Keck Suzan
Bought by
Hummer Richard H and Hummer Tabitha L
Current Estimated Value
Home Financials for this Owner
Home Financials are based on the most recent Mortgage that was taken out on this home.
Original Mortgage
$204,250
Outstanding Balance
$202,443
Interest Rate
7.25%
Mortgage Type
New Conventional
Estimated Equity
$41,036
Purchase Details
Closed on
Jul 12, 2017
Sold by
Keck Herbert A and Revoca Laverne C Keck
Bought by
Keck Robbie and Keck Suzan
Purchase Details
Closed on
Feb 23, 2011
Sold by
Keck Laverne C
Bought by
Keck Laverne C
Create a Home Valuation Report for This Property
The Home Valuation Report is an in-depth analysis detailing your home's value as well as a comparison with similar homes in the area
Home Values in the Area
Average Home Value in this Area
Purchase History
| Date | Buyer | Sale Price | Title Company |
|---|---|---|---|
| Hummer Richard H | -- | None Listed On Document | |
| Keck Robbie | -- | None Available | |
| Keck Laverne C | -- | None Available |
Source: Public Records
Mortgage History
| Date | Status | Borrower | Loan Amount |
|---|---|---|---|
| Open | Hummer Richard H | $204,250 |
Source: Public Records
Tax History Compared to Growth
Tax History
| Year | Tax Paid | Tax Assessment Tax Assessment Total Assessment is a certain percentage of the fair market value that is determined by local assessors to be the total taxable value of land and additions on the property. | Land | Improvement |
|---|---|---|---|---|
| 2024 | $3,145 | $250,700 | $45,600 | $205,100 |
| 2022 | $3,145 | $182,800 | $35,100 | $147,700 |
| 2021 | $2,558 | $156,100 | $29,200 | $126,900 |
| 2020 | $2,252 | $142,300 | $26,600 | $115,700 |
| 2019 | $2,128 | $135,700 | $25,600 | $110,100 |
| 2018 | $2,247 | $136,600 | $24,800 | $111,800 |
| 2017 | $845 | $131,100 | $24,100 | $107,000 |
| 2016 | $776 | $131,100 | $24,100 | $107,000 |
| 2014 | $808 | $129,900 | $24,600 | $105,300 |
Source: Public Records
Map
Nearby Homes
- 1461 N Queen Rd
- 14145 1st Rd
- 28289 Stanton Rd
- TBD 3b Rd
- TBD W 1st Rd
- 4168 N Sycamore Rd
- 3155 Nutmeg Rd
- 4632 Queen Rd
- 710 S Michigan St
- 17580 Vine St
- 750 S Michigan St
- 212 S Michigan St
- 68555 Oak Rd
- 12909 Tyler Rd
- 3741 N Thorn Rd
- 5099 Sage Rd
- 2031 Lilac Rd
- 3488 Maple Rd
- 905 Van Buren St
- 802 Roosevelt Rd
- 1317 N Queen Rd
- 1393 N Queen Rd
- 1255 N Queen Rd
- 1422 N Queen Rd
- 1260 N Queen Rd
- 1564 N Queen Rd
- 1098 N Queen Rd
- 1087 N Queen Rd
- 1637 N Queen Rd
- 1644 N Queen Rd
- 16581 1st Rd
- 16519 1st Rd
- 978 N Queen Rd
- 16478 1st Rd
- 16558 1st Rd
- 16542 1st Rd
- 16658 W 1st Rd
- 16578 1st Rd
- 16366 1st Rd
- 0 Taylor St Unit 814043