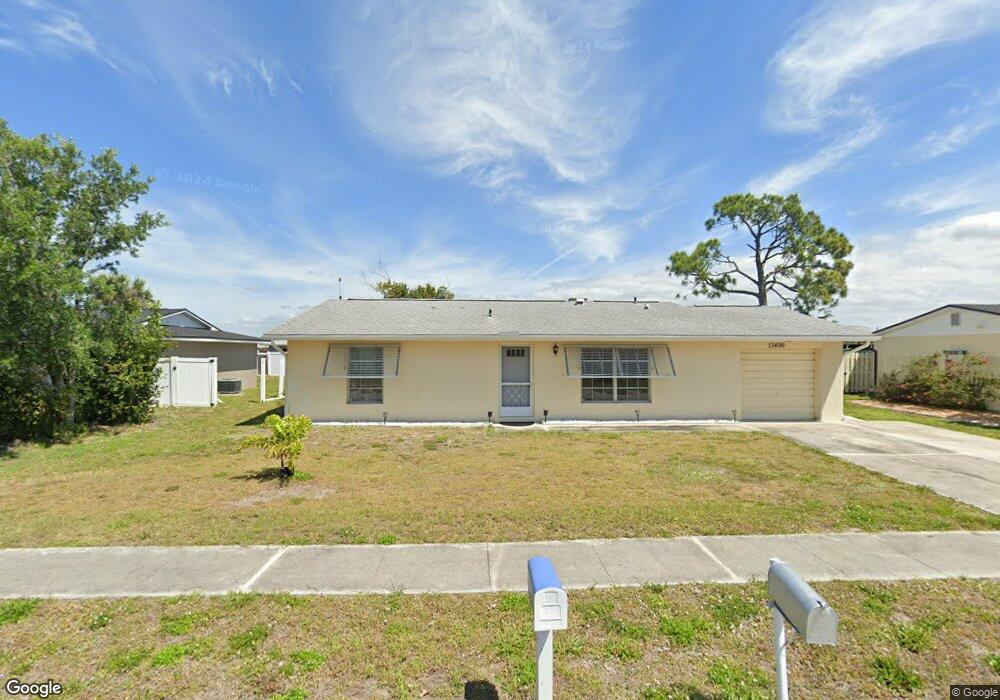
13496 Martha Ave Port Charlotte, FL 33981
Gulf Cove NeighborhoodEstimated Value: $154,000 - $208,000
2
Beds
2
Baths
1,001
Sq Ft
$187/Sq Ft
Est. Value
About This Home
This home is located at 13496 Martha Ave, Port Charlotte, FL 33981 and is currently estimated at $186,736, approximately $186 per square foot. 13496 Martha Ave is a home located in Charlotte County with nearby schools including Myakka River Elementary School, L.A. Ainger Middle School, and Lemon Bay High School.
Ownership History
Date
Name
Owned For
Owner Type
Purchase Details
Closed on
Jan 8, 2020
Sold by
Ahlin Urban
Bought by
Ahlin Jenni and Ahlin Urban
Current Estimated Value
Purchase Details
Closed on
Apr 14, 2008
Sold by
Morgan Virginia S and Ellen S Hawker Revocable Trust
Bought by
Ahlin Urban
Purchase Details
Closed on
Mar 15, 2004
Sold by
Hawker Ellen S
Bought by
Hawker Ellen S and Ellen S Hawker Revocable Trust
Purchase Details
Closed on
Jun 24, 2002
Sold by
Barrett Catherine L
Bought by
Hawker John T and Hawker Ellen S
Home Financials for this Owner
Home Financials are based on the most recent Mortgage that was taken out on this home.
Original Mortgage
$76,500
Interest Rate
6.86%
Mortgage Type
VA
Purchase Details
Closed on
Apr 26, 2000
Sold by
Poszwa Edward and Poszwa Judy
Bought by
Barrett Catherine L
Purchase Details
Closed on
Jan 14, 1999
Sold by
Sides Evelyn M and Sides Orvie E
Bought by
Poszwa Edward and Poszwa Judy
Create a Home Valuation Report for This Property
The Home Valuation Report is an in-depth analysis detailing your home's value as well as a comparison with similar homes in the area
Home Values in the Area
Average Home Value in this Area
Purchase History
| Date | Buyer | Sale Price | Title Company |
|---|---|---|---|
| Ahlin Jenni | -- | None Available | |
| Ahlin Urban | $75,000 | Executive Title Ins Svcs Inc | |
| Hawker Ellen S | -- | -- | |
| Hawker John T | $75,000 | -- | |
| Barrett Catherine L | $57,900 | -- | |
| Poszwa Edward | $54,900 | -- |
Source: Public Records
Mortgage History
| Date | Status | Borrower | Loan Amount |
|---|---|---|---|
| Previous Owner | Hawker John T | $76,500 |
Source: Public Records
Tax History Compared to Growth
Tax History
| Year | Tax Paid | Tax Assessment Tax Assessment Total Assessment is a certain percentage of the fair market value that is determined by local assessors to be the total taxable value of land and additions on the property. | Land | Improvement |
|---|---|---|---|---|
| 2023 | $2,731 | $102,223 | $0 | $0 |
| 2022 | $2,541 | $122,007 | $19,550 | $102,457 |
| 2021 | $2,268 | $85,824 | $10,625 | $75,199 |
| 2020 | $2,158 | $83,952 | $10,200 | $73,752 |
| 2019 | $2,008 | $79,084 | $10,200 | $68,884 |
| 2018 | $1,582 | $71,214 | $10,200 | $61,014 |
| 2017 | $1,486 | $63,390 | $6,715 | $56,675 |
| 2016 | $1,418 | $52,457 | $0 | $0 |
| 2015 | $1,289 | $47,688 | $0 | $0 |
| 2014 | $1,205 | $43,353 | $0 | $0 |
Source: Public Records
Map
Nearby Homes
- 13477 Martha Ave
- 13525 Dibella Ave
- 13540 Dibella Ave
- 6294 Thorman Rd
- 6191 Drucker Cir
- 13450 Bennett Dr
- 6113 Mckee St
- 13532 Romford Ave
- 6322 Thorman Rd
- 13579 Romford Ave
- 13495 Longwood Ave
- 13463 Longwood Ave
- 13482 Darnell Ave
- 13575 Clara Ln
- 13592 Clara Ln
- 13366 Bronze Ave
- 6540 Coliseum Blvd
- 13375 Bronze Ave
- 13476 Newport Ave
- 13495 Newport Ave
- 13488 Martha Ave
- 13505 Isabell Ave
- 13497 Isabell Ave
- 13512 Martha Ave
- 13478 Avenue
- 13478 Martha Ave
- 13503 Martha Ave
- 13487 Martha Ave
- 13479 Isabell Ave
- 13521 Isabell Ave
- 13511 Martha Ave
- 13520 Martha Ave
- 13496 Isabell Ave
- 13496 Overton Ave
- 13504 Isabell Ave
- 13488 Overton Ave
- 13488 Isabell Ave
- 13504 Overton Ave
- 13512 Isabell Ave
- 13480 Overton Ave