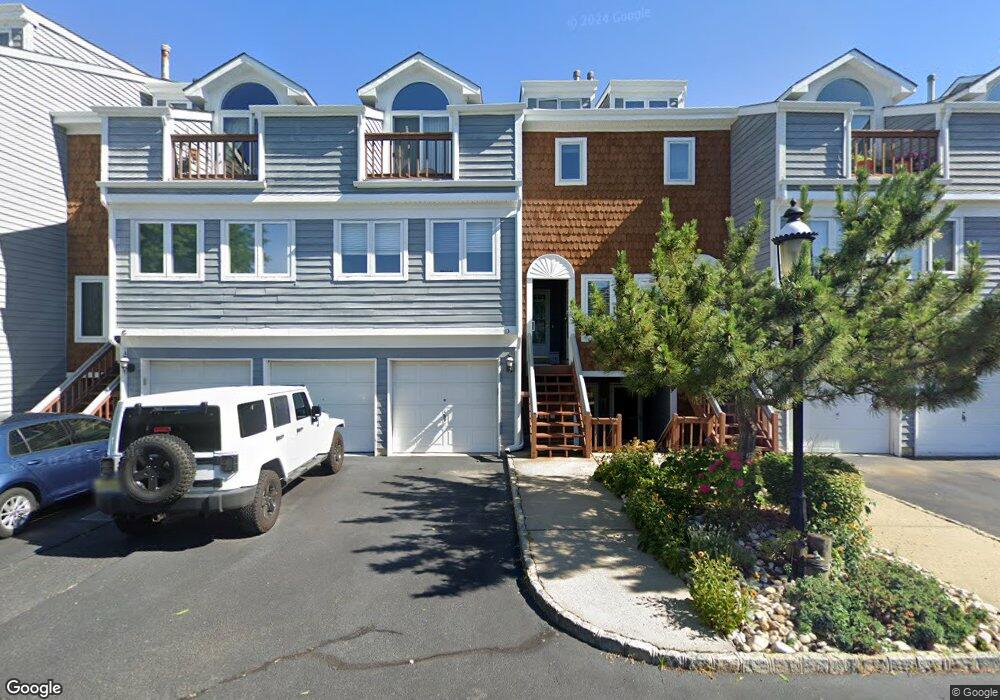
135 1st St Unit 3F Keyport, NJ 07735
Estimated Value: $679,236 - $747,000
3
Beds
2
Baths
2,169
Sq Ft
$326/Sq Ft
Est. Value
About This Home
This home is located at 135 1st St Unit 3F, Keyport, NJ 07735 and is currently estimated at $707,809, approximately $326 per square foot. 135 1st St Unit 3F is a home located in Monmouth County with nearby schools including Keyport Central School, Keyport High School, and Icob Academy.
Ownership History
Date
Name
Owned For
Owner Type
Purchase Details
Closed on
Jul 10, 2013
Sold by
Mcginty John and Mcginty Susan
Bought by
Golan Samuel and Golan Dina
Current Estimated Value
Home Financials for this Owner
Home Financials are based on the most recent Mortgage that was taken out on this home.
Original Mortgage
$250,000
Outstanding Balance
$181,787
Interest Rate
3.92%
Mortgage Type
New Conventional
Estimated Equity
$526,022
Purchase Details
Closed on
Apr 28, 2003
Sold by
Vanmeter Bruce
Bought by
Mcginty John and Mcginty Susan
Home Financials for this Owner
Home Financials are based on the most recent Mortgage that was taken out on this home.
Original Mortgage
$212,000
Interest Rate
5.93%
Purchase Details
Closed on
Jun 1, 1998
Sold by
Granata Louis
Bought by
Vanmeter Bruce
Home Financials for this Owner
Home Financials are based on the most recent Mortgage that was taken out on this home.
Original Mortgage
$160,000
Interest Rate
7.05%
Purchase Details
Closed on
Sep 28, 1995
Sold by
The Harbor View At Keyport Inc
Bought by
Yacker Stanley and Granata Louis
Home Financials for this Owner
Home Financials are based on the most recent Mortgage that was taken out on this home.
Original Mortgage
$20,000
Interest Rate
7.89%
Create a Home Valuation Report for This Property
The Home Valuation Report is an in-depth analysis detailing your home's value as well as a comparison with similar homes in the area
Home Values in the Area
Average Home Value in this Area
Purchase History
| Date | Buyer | Sale Price | Title Company |
|---|---|---|---|
| Golan Samuel | $335,000 | Chicago Title Insurance Co | |
| Mcginty John | $350,000 | -- | |
| Vanmeter Bruce | $200,000 | -- | |
| Yacker Stanley | $220,000 | -- |
Source: Public Records
Mortgage History
| Date | Status | Borrower | Loan Amount |
|---|---|---|---|
| Open | Golan Samuel | $250,000 | |
| Previous Owner | Mcginty John | $212,000 | |
| Previous Owner | Vanmeter Bruce | $160,000 | |
| Previous Owner | Yacker Stanley | $20,000 |
Source: Public Records
Tax History Compared to Growth
Tax History
| Year | Tax Paid | Tax Assessment Tax Assessment Total Assessment is a certain percentage of the fair market value that is determined by local assessors to be the total taxable value of land and additions on the property. | Land | Improvement |
|---|---|---|---|---|
| 2025 | $12,445 | $654,000 | $196,200 | $457,800 |
| 2024 | $12,445 | $594,500 | $178,300 | $416,200 |
| 2023 | $12,445 | $566,200 | $169,900 | $396,300 |
| 2022 | $10,146 | $492,400 | $147,700 | $344,700 |
| 2021 | $10,146 | $402,000 | $120,600 | $281,400 |
| 2020 | $10,223 | $402,000 | $117,700 | $284,300 |
| 2019 | $8,506 | $335,000 | $117,700 | $217,300 |
| 2018 | $8,710 | $335,000 | $117,700 | $217,300 |
| 2017 | $8,733 | $335,000 | $117,700 | $217,300 |
| 2016 | $8,660 | $335,000 | $117,700 | $217,300 |
| 2015 | $8,700 | $335,000 | $117,700 | $217,300 |
| 2014 | $8,745 | $340,000 | $155,900 | $184,100 |
Source: Public Records
Map
Nearby Homes
- 135 1st St Unit 2E
- 135 1st St Unit 2D
- 135 1st St Unit 2B
- 135 1st St Unit 3H
- 135 1st St Unit 1C
- 135 1st St Unit 2F
- 135 1st St Unit 1A
- 135 1st St Unit 1B
- 135 1st St Unit 2A
- 135 1st St Unit 2H
- 135 1st St Unit 3G
- 135 1st St Unit 3D
- 135 1st St Unit 1G
- 135 1st St Unit 3E
- 135 1st St Unit 3A
- 135 1st St Unit 3C
- 135 1st St Unit 2G
- 135 1st St Unit 2C
- 135 1st St Unit 1H
- 135 1st St Unit 1F