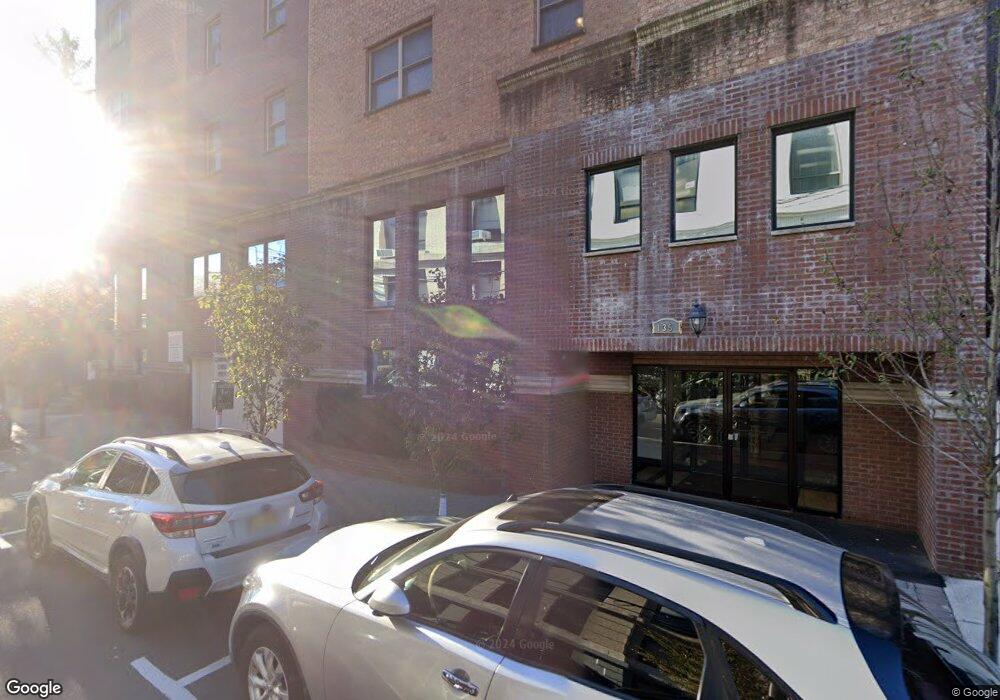
135 38th St Unit 601 Union City, NJ 07087
Estimated Value: $398,000 - $515,161
--
Bed
--
Bath
1,074
Sq Ft
$435/Sq Ft
Est. Value
About This Home
This home is located at 135 38th St Unit 601, Union City, NJ 07087 and is currently estimated at $467,290, approximately $435 per square foot. 135 38th St Unit 601 is a home located in Hudson County with nearby schools including Washington Elementary School, Jefferson Elementary School, and Sara M. Gilmore Academy.
Ownership History
Date
Name
Owned For
Owner Type
Purchase Details
Closed on
May 31, 2022
Sold by
Borjiged and Narenmandula
Bought by
Oates Wayne E and Telesea Christina M
Current Estimated Value
Purchase Details
Closed on
May 14, 2021
Sold by
Ahuja Himal
Bought by
Emelle Ofomezie
Home Financials for this Owner
Home Financials are based on the most recent Mortgage that was taken out on this home.
Original Mortgage
$370,500
Interest Rate
2.9%
Mortgage Type
New Conventional
Purchase Details
Closed on
May 20, 2008
Sold by
Hudson Avenue Joint Venture Llc
Bought by
Cruz Magdala C
Home Financials for this Owner
Home Financials are based on the most recent Mortgage that was taken out on this home.
Original Mortgage
$280,000
Interest Rate
6.11%
Mortgage Type
Purchase Money Mortgage
Purchase Details
Closed on
Dec 19, 2007
Sold by
Hudson Avenue Joint Venture Llc
Bought by
Geller Jason and Kaneko Mikiko
Create a Home Valuation Report for This Property
The Home Valuation Report is an in-depth analysis detailing your home's value as well as a comparison with similar homes in the area
Home Values in the Area
Average Home Value in this Area
Purchase History
| Date | Buyer | Sale Price | Title Company |
|---|---|---|---|
| Oates Wayne E | $401,000 | American Land Title | |
| Emelle Ofomezie | $390,000 | Sunnyside Title Agency Llc | |
| Cruz Magdala C | $355,000 | None Available | |
| Geller Jason | $300,000 | Lawyers Title Insurance Corp |
Source: Public Records
Mortgage History
| Date | Status | Borrower | Loan Amount |
|---|---|---|---|
| Previous Owner | Emelle Ofomezie | $370,500 | |
| Previous Owner | Cruz Magdala C | $280,000 |
Source: Public Records
Tax History Compared to Growth
Tax History
| Year | Tax Paid | Tax Assessment Tax Assessment Total Assessment is a certain percentage of the fair market value that is determined by local assessors to be the total taxable value of land and additions on the property. | Land | Improvement |
|---|---|---|---|---|
| 2025 | $7,987 | $456,800 | $176,300 | $280,500 |
| 2024 | $10,517 | $432,200 | $155,500 | $276,700 |
| 2023 | $9,768 | $136,800 | $15,800 | $121,000 |
| 2022 | $9,768 | $136,800 | $15,800 | $121,000 |
| 2021 | $9,732 | $136,800 | $15,800 | $121,000 |
| 2020 | $7,229 | $136,800 | $15,800 | $121,000 |
| 2019 | $9,369 | $136,800 | $15,800 | $121,000 |
| 2018 | $9,100 | $136,800 | $15,800 | $121,000 |
| 2017 | $9,080 | $136,800 | $15,800 | $121,000 |
| 2016 | $9,426 | $136,800 | $15,800 | $121,000 |
| 2015 | $8,914 | $136,800 | $15,800 | $121,000 |
| 2014 | $8,716 | $136,800 | $15,800 | $121,000 |
Source: Public Records
Map
Nearby Homes
- 150 37th St Unit D4
- 149 37th St
- 122 37th St
- 209 40th St Unit 3B
- 82 Highwood Terrace
- 121 41st St Unit 1
- 4017 Hudson Ave
- 211 41st St
- 205 42nd St
- 115 34th St
- 113 34th St
- 111 34th St
- 83 Liberty Place Unit 2
- 83 Liberty Place
- 83 Liberty Place Unit 1
- 4108 New York Ave
- 46 Highwood Terrace
- 88 Sterling Ave
- 416 41st St
- 4208-4214 New York Ave
- 135 38th St
- 135 38th St Unit 606
- 135 38th St Unit 308
- 135 38th St Unit 408
- 135 38th St Unit D404
- 135 38th St Unit 607
- 135 38th St Unit 507
- 135 38th St
- 135 38th St Unit 506
- 135 38th St
- 135 38th St Unit 306
- 135 38th St
- 135 38th St Unit 505
- 135 38th St Unit 405
- 135 38th St Unit 305
- 135 38th St Unit 604
- 135 38th St Unit 504
- 135 38th St
- 135 38th St
- 135 38th St