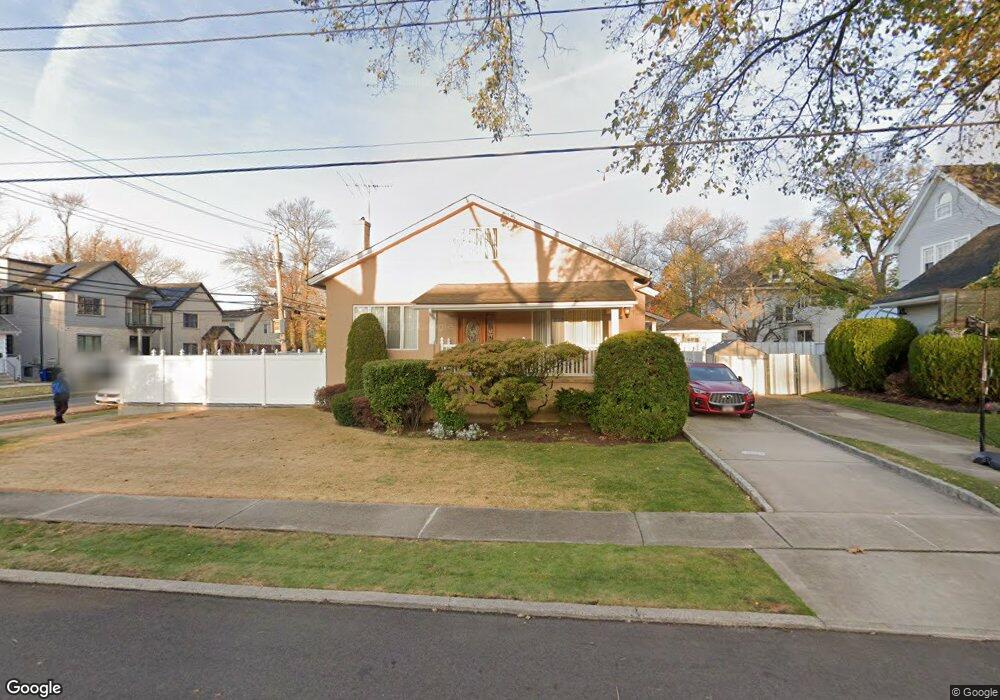
135 9th St Staten Island, NY 10306
New Dorp NeighborhoodEstimated Value: $847,557 - $1,026,000
--
Bed
4
Baths
2,005
Sq Ft
$474/Sq Ft
Est. Value
About This Home
This home is located at 135 9th St, Staten Island, NY 10306 and is currently estimated at $951,139, approximately $474 per square foot. 135 9th St is a home located in Richmond County with nearby schools including P.S. 41 The Stephanie a Vierno School, Is 2 George L Egbert, and New Dorp High School.
Ownership History
Date
Name
Owned For
Owner Type
Purchase Details
Closed on
Jun 24, 2020
Sold by
Koc Mustafa and Koc Tugce
Bought by
Emil Elmuras and Emil Aigerim
Current Estimated Value
Home Financials for this Owner
Home Financials are based on the most recent Mortgage that was taken out on this home.
Original Mortgage
$616,000
Outstanding Balance
$545,009
Interest Rate
3.1%
Mortgage Type
New Conventional
Estimated Equity
$406,130
Purchase Details
Closed on
Aug 31, 2017
Sold by
Boumoussa Nassif and Boumoussa Eva
Bought by
Boumoussa Nassif
Create a Home Valuation Report for This Property
The Home Valuation Report is an in-depth analysis detailing your home's value as well as a comparison with similar homes in the area
Home Values in the Area
Average Home Value in this Area
Purchase History
| Date | Buyer | Sale Price | Title Company |
|---|---|---|---|
| Emil Elmuras | $770,000 | Jewett Abstract Corp | |
| Boumoussa Nassif | -- | None Available |
Source: Public Records
Mortgage History
| Date | Status | Borrower | Loan Amount |
|---|---|---|---|
| Open | Emil Elmuras | $616,000 |
Source: Public Records
Tax History Compared to Growth
Tax History
| Year | Tax Paid | Tax Assessment Tax Assessment Total Assessment is a certain percentage of the fair market value that is determined by local assessors to be the total taxable value of land and additions on the property. | Land | Improvement |
|---|---|---|---|---|
| 2025 | $7,923 | $53,280 | $11,407 | $41,873 |
| 2024 | $7,935 | $51,780 | $11,738 | $40,042 |
| 2023 | $7,945 | $40,522 | $11,228 | $29,294 |
| 2022 | $6,967 | $44,160 | $14,880 | $29,280 |
| 2021 | $7,290 | $44,820 | $14,880 | $29,940 |
| 2020 | $6,906 | $44,100 | $14,880 | $29,220 |
| 2019 | $6,828 | $42,300 | $14,880 | $27,420 |
| 2018 | $6,586 | $33,768 | $10,820 | $22,948 |
| 2017 | $6,197 | $31,869 | $13,085 | $18,784 |
| 2016 | $5,701 | $30,066 | $13,291 | $16,775 |
| 2015 | $5,139 | $28,365 | $11,078 | $17,287 |
| 2014 | $5,139 | $28,365 | $12,413 | $15,952 |
Source: Public Records
Map
Nearby Homes
- 109 8th St
- 91 Allison Ave
- 193 10 St
- 193 10th St
- 129 New Dorp Plaza N
- 20 8 St
- 20 8th St
- 52A Francine Ct Unit 80A
- 52 Francine Ct Unit A
- 25 4th St
- 32 Francine Ct Unit B
- 20 Francine Ct Unit A
- 305 Tysens Ln Unit B
- 13 Ella Place
- 80 1st St
- 79 Cloister Place
- 373 Rose Ave
- 215 Cannon Blvd
- 77 Penn Ave
- 218 Cannon Blvd