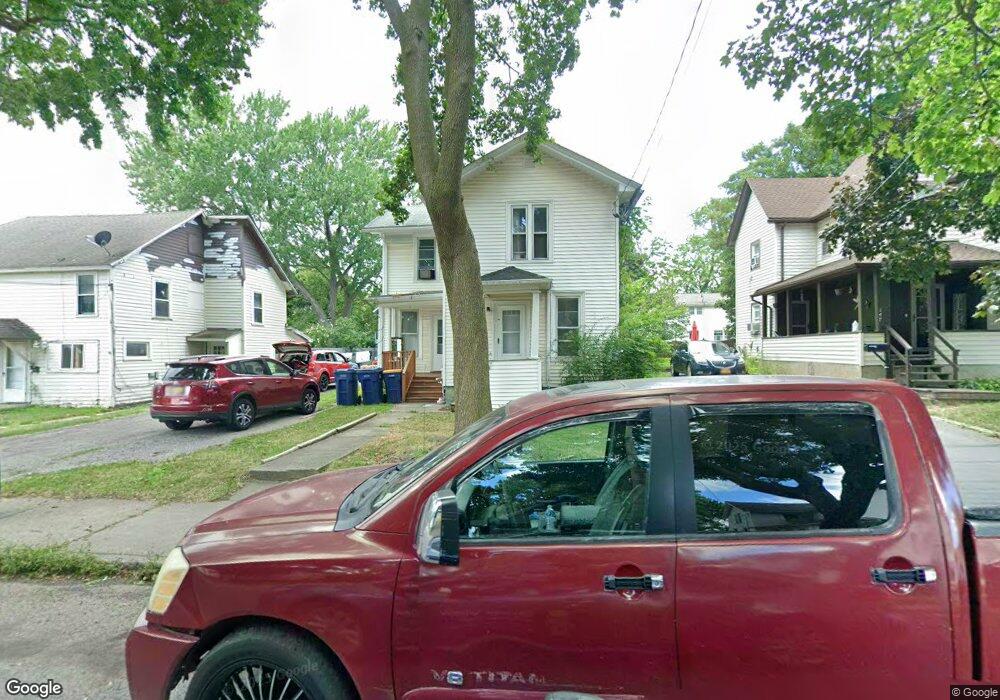
135 Allen St Lockport, NY 14094
Estimated Value: $155,000 - $172,000
3
Beds
2
Baths
1,468
Sq Ft
$112/Sq Ft
Est. Value
About This Home
This home is located at 135 Allen St, Lockport, NY 14094 and is currently estimated at $164,924, approximately $112 per square foot. 135 Allen St is a home located in Niagara County with nearby schools including Aaron Mossell Junior High School, Lockport High School, and DeSales Catholic School.
Ownership History
Date
Name
Owned For
Owner Type
Purchase Details
Closed on
Jun 2, 2023
Sold by
Mullen Donald E
Bought by
Dlp716 Inc
Current Estimated Value
Purchase Details
Closed on
Oct 15, 2014
Sold by
City Of Lockport
Bought by
Mullen Donald
Purchase Details
Closed on
Oct 14, 2014
Sold by
Niagara County Treasurer
Bought by
Mullen Donald E
Purchase Details
Closed on
Sep 9, 2014
Sold by
Gillis Gregory and Rosenbeck John
Bought by
City Of Lockport
Purchase Details
Closed on
Apr 27, 2011
Sold by
Ncs Community Development Corp
Bought by
Rosewarbne Bruce
Home Financials for this Owner
Home Financials are based on the most recent Mortgage that was taken out on this home.
Original Mortgage
$20,000
Interest Rate
4.58%
Mortgage Type
Purchase Money Mortgage
Purchase Details
Closed on
Sep 28, 2009
Sold by
Keleher Life Use Mary
Bought by
Ncs Community Development Corp
Create a Home Valuation Report for This Property
The Home Valuation Report is an in-depth analysis detailing your home's value as well as a comparison with similar homes in the area
Home Values in the Area
Average Home Value in this Area
Purchase History
| Date | Buyer | Sale Price | Title Company |
|---|---|---|---|
| Dlp716 Inc | $17,000 | None Listed On Document | |
| Mullen Donald | -- | -- | |
| Mullen Donald E | $17,000 | None Available | |
| City Of Lockport | -- | None Available | |
| Rosewarbne Bruce | $20,300 | None Available | |
| Ncs Community Development Corp | -- | Mark Greisberger |
Source: Public Records
Mortgage History
| Date | Status | Borrower | Loan Amount |
|---|---|---|---|
| Previous Owner | Rosewarbne Bruce | $20,000 |
Source: Public Records
Tax History Compared to Growth
Tax History
| Year | Tax Paid | Tax Assessment Tax Assessment Total Assessment is a certain percentage of the fair market value that is determined by local assessors to be the total taxable value of land and additions on the property. | Land | Improvement |
|---|---|---|---|---|
| 2024 | $3,370 | $124,000 | $3,800 | $120,200 |
| 2023 | $3,327 | $119,000 | $3,800 | $115,200 |
| 2022 | $2,611 | $108,000 | $3,800 | $104,200 |
| 2021 | $2,634 | $66,800 | $4,300 | $62,500 |
| 2020 | $2,577 | $66,800 | $4,300 | $62,500 |
| 2019 | $577 | $66,800 | $4,300 | $62,500 |
| 2018 | $1,864 | $66,800 | $4,300 | $62,500 |
| 2017 | $1,857 | $66,800 | $4,300 | $62,500 |
| 2016 | $1,798 | $66,800 | $4,300 | $62,500 |
| 2015 | -- | $66,800 | $4,300 | $62,500 |
| 2014 | -- | $66,800 | $4,300 | $62,500 |
Source: Public Records
Map
Nearby Homes