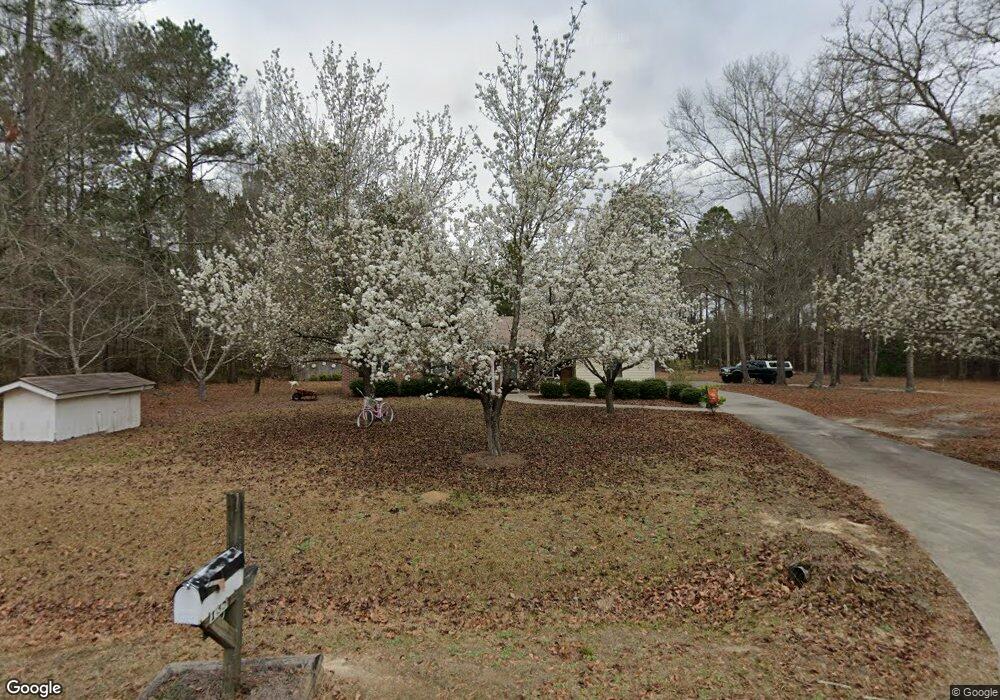
135 Alvin Purser Rd Cochran, GA 31014
Estimated Value: $146,401 - $202,000
2
Beds
1
Bath
1,323
Sq Ft
$126/Sq Ft
Est. Value
About This Home
This home is located at 135 Alvin Purser Rd, Cochran, GA 31014 and is currently estimated at $166,350, approximately $125 per square foot. 135 Alvin Purser Rd is a home located in Bleckley County with nearby schools including Bleckley County Primary School, Bleckley County Elementary School, and Bleckley Middle School.
Ownership History
Date
Name
Owned For
Owner Type
Purchase Details
Closed on
May 20, 2022
Sold by
Preston Edward C Estate
Bought by
Herndon Leann
Current Estimated Value
Home Financials for this Owner
Home Financials are based on the most recent Mortgage that was taken out on this home.
Original Mortgage
$131,313
Outstanding Balance
$124,587
Interest Rate
5.11%
Mortgage Type
New Conventional
Estimated Equity
$41,763
Purchase Details
Closed on
Sep 16, 2009
Sold by
Jackson Julian Franklin
Bought by
Preston Edward C
Purchase Details
Closed on
Dec 18, 2001
Sold by
Umberger Howard F
Bought by
Jackson Julian F
Purchase Details
Closed on
Jan 6, 1998
Sold by
Dykes Betty H
Bought by
Umberger Howard F
Purchase Details
Closed on
Nov 25, 1997
Bought by
Umberger Howard F
Purchase Details
Closed on
Feb 15, 1995
Sold by
Miller Steve R
Bought by
Dykes Betty H
Purchase Details
Closed on
Jul 9, 1993
Bought by
Miller Steve R
Create a Home Valuation Report for This Property
The Home Valuation Report is an in-depth analysis detailing your home's value as well as a comparison with similar homes in the area
Home Values in the Area
Average Home Value in this Area
Purchase History
| Date | Buyer | Sale Price | Title Company |
|---|---|---|---|
| Herndon Leann | $130,000 | -- | |
| Preston Edward C | $88,400 | -- | |
| Jackson Julian F | $65,000 | -- | |
| Umberger Howard F | $44,000 | -- | |
| Umberger Howard F | -- | -- | |
| Dykes Betty H | $40,800 | -- | |
| Miller Steve R | -- | -- |
Source: Public Records
Mortgage History
| Date | Status | Borrower | Loan Amount |
|---|---|---|---|
| Open | Herndon Leann | $131,313 |
Source: Public Records
Tax History Compared to Growth
Tax History
| Year | Tax Paid | Tax Assessment Tax Assessment Total Assessment is a certain percentage of the fair market value that is determined by local assessors to be the total taxable value of land and additions on the property. | Land | Improvement |
|---|---|---|---|---|
| 2024 | $1,236 | $46,224 | $4,080 | $42,144 |
| 2023 | $1,283 | $46,224 | $4,080 | $42,144 |
| 2022 | $1,065 | $41,144 | $4,080 | $37,064 |
| 2021 | $845 | $31,024 | $3,240 | $27,784 |
| 2020 | $845 | $31,024 | $3,240 | $27,784 |
| 2019 | $903 | $32,952 | $3,840 | $29,112 |
| 2018 | $969 | $32,952 | $3,840 | $29,112 |
| 2017 | $910 | $32,952 | $3,840 | $29,112 |
| 2016 | $910 | $32,952 | $3,840 | $29,112 |
| 2015 | -- | $32,952 | $3,840 | $29,112 |
| 2014 | -- | $32,952 | $3,840 | $29,112 |
| 2013 | -- | $32,951 | $3,840 | $29,111 |
Source: Public Records
Map
Nearby Homes
- 205 Smith Sapp Rd
- 0 Jones Rd
- 178 Country Club Cir
- 319 Country Club Rd
- 0 Cheek Rd
- 0 Rock Hill Rd
- 191 Cheek Rd
- 166 Pebble Hills Rd
- 156 Churchwell Rd
- 176 Pineland Estates Rd
- 0 Churchwell Rd Unit 255785
- 0 Churchwell Rd Unit 24917742
- 288 Frank Cook Rd
- 238 Wood Oak Cir
- 110 Chestnut Dr
- Lots Crest Dr
- LAND Crest Dr
- 762 Nicholson Carr Rd
- 10 Timber Way
- 7 Evergreen Dr
- 127 Alvin Purser Rd
- 151 Alvin Purser Rd
- 140 Alvin Purser Rd
- 1116 Ga Highway 126
- 161 Alvin Purser Rd
- 156 Alvin Purser Rd
- 1099 Ga Highway 126
- 167 Alvin Purser Rd
- 118 Alvin Purser Rd
- 141 Bass Mullis Smith Rd
- 141 Bass-Mullis-smith Rd
- 162 Alvin Purser Rd
- 1070 State Route 126
- 1070 Ga Highway 126
- 1070 Ga Highway 126
- 1070 Ga Highway 126
- 1070 Ga Highway 126
- 1070 Ga Highway 126
- 1125 Ga Highway 126
- 111 Bass Mullis Smith Rd