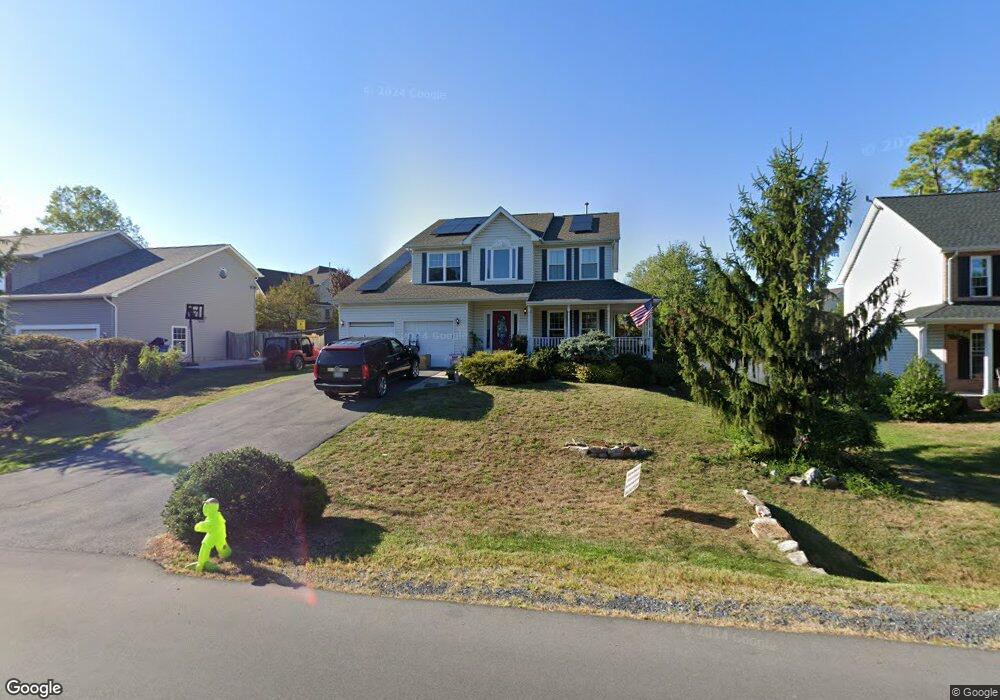
135 Asbury Rd Winchester, VA 22602
Estimated Value: $489,000 - $517,861
5
Beds
4
Baths
3,067
Sq Ft
$164/Sq Ft
Est. Value
About This Home
This home is located at 135 Asbury Rd, Winchester, VA 22602 and is currently estimated at $501,965, approximately $163 per square foot. 135 Asbury Rd is a home located in Frederick County with nearby schools including Redbud Run Elementary School, James Wood Middle School, and Millbrook High School.
Ownership History
Date
Name
Owned For
Owner Type
Purchase Details
Closed on
Jul 14, 2011
Sold by
Federal Home Loan Mortgage Corporation
Bought by
Gebhardt John
Current Estimated Value
Home Financials for this Owner
Home Financials are based on the most recent Mortgage that was taken out on this home.
Original Mortgage
$156,000
Outstanding Balance
$107,374
Interest Rate
4.52%
Mortgage Type
New Conventional
Estimated Equity
$394,591
Purchase Details
Closed on
Mar 28, 2011
Sold by
Samuel I White Pc Sub Tr
Bought by
Federal Home Loan Mortgage Corporation
Purchase Details
Closed on
Aug 30, 2002
Sold by
Leone Danny L
Bought by
Eng Daniel W
Home Financials for this Owner
Home Financials are based on the most recent Mortgage that was taken out on this home.
Original Mortgage
$207,900
Interest Rate
6.55%
Create a Home Valuation Report for This Property
The Home Valuation Report is an in-depth analysis detailing your home's value as well as a comparison with similar homes in the area
Home Values in the Area
Average Home Value in this Area
Purchase History
| Date | Buyer | Sale Price | Title Company |
|---|---|---|---|
| Gebhardt John | $198,000 | -- | |
| Federal Home Loan Mortgage Corporation | $200,658 | -- | |
| Eng Daniel W | $259,900 | -- |
Source: Public Records
Mortgage History
| Date | Status | Borrower | Loan Amount |
|---|---|---|---|
| Open | Gebhardt John | $156,000 | |
| Previous Owner | Eng Daniel W | $207,900 |
Source: Public Records
Tax History Compared to Growth
Tax History
| Year | Tax Paid | Tax Assessment Tax Assessment Total Assessment is a certain percentage of the fair market value that is determined by local assessors to be the total taxable value of land and additions on the property. | Land | Improvement |
|---|---|---|---|---|
| 2025 | $2,400 | $500,100 | $93,000 | $407,100 |
| 2024 | $1,135 | $445,200 | $77,000 | $368,200 |
| 2023 | $2,271 | $445,200 | $77,000 | $368,200 |
| 2022 | $2,220 | $364,000 | $72,000 | $292,000 |
| 2021 | $2,220 | $364,000 | $72,000 | $292,000 |
| 2020 | $2,040 | $334,400 | $72,000 | $262,400 |
| 2019 | $2,040 | $334,400 | $72,000 | $262,400 |
| 2018 | $1,735 | $284,500 | $72,000 | $212,500 |
| 2017 | $1,707 | $284,500 | $72,000 | $212,500 |
| 2016 | $1,569 | $261,500 | $59,500 | $202,000 |
| 2015 | $1,464 | $261,500 | $59,500 | $202,000 |
| 2014 | $734 | $248,800 | $54,500 | $194,300 |
Source: Public Records
Map
Nearby Homes
- 133 Asbury Rd
- 122 Battlefield Dr
- 120 Battlefield Dr
- 108 Tucks Cir
- 118 Battlefield Dr
- 134 Asbury Rd
- 116 Battlefield Dr
- 100 Cannon Cir
- 110 Tucks Cir
- 106 Tucks Cir
- 132 Asbury Rd
- 114 Battlefield Dr
- 123 Battlefield Dr
- 106 Cannon Cir
- 100 Tucks Cir
- 121 Battlefield Dr
- 101 Cannon Cir
- 130 Asbury Rd
- 111 Tucks Cir
- 112 Battlefield Dr