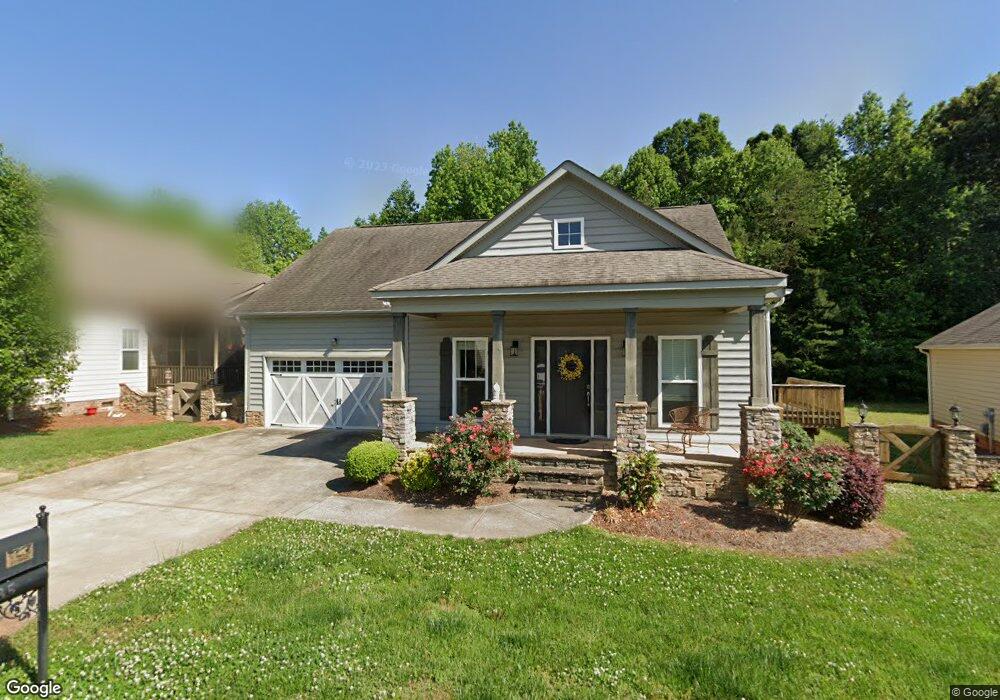
135 Battery Dr Locust, NC 28097
Estimated Value: $339,039 - $366,000
About This Home
This home is located at 135 Battery Dr, Locust, NC 28097 and is currently estimated at $351,760, approximately $206 per square foot. 135 Battery Dr is a home located in Stanly County with nearby schools including Locust Elementary School, West Stanly Middle School, and West Stanly High School.
Ownership History
We collect this data history from publicly available records. To have your information removed, we recommend requesting removal directly through your county’s website.
Purchase Details
Purchase Details
Home Financials for this Owner
Home Financials are based on the most recent Mortgage that was taken out on this home.Purchase Details
Purchase Details
Home Financials for this Owner
Home Financials are based on the most recent Mortgage that was taken out on this home.Home Values in the Area
Average Home Value in this Area
Purchase History
We collect this data history from publicly available records. To have your information removed, we recommend requesting removal directly through your county’s website.
| Date | Buyer | Sale Price | Title Company |
|---|---|---|---|
| -- | None Available | ||
| $155,000 | None Available | ||
| -- | None Available | ||
| $204,000 | None Available |
Mortgage History
We collect this data history from publicly available records. To have your information removed, we recommend requesting removal directly through your county’s website.
| Date | Status | Borrower | Loan Amount |
|---|---|---|---|
| Open | $124,000 | ||
| Previous Owner | $163,164 |
Tax History
We collect this data history from publicly available records. To have your information removed, we recommend requesting removal directly through your county’s website.
| Year | Tax Paid | Tax Assessment Tax Assessment Total Assessment is a certain percentage of the fair market value that is determined by local assessors to be the total taxable value of land and additions on the property. | Land | Improvement |
|---|---|---|---|---|
| 2025 | $2,843 | $308,980 | $60,000 | $248,980 |
| 2024 | $2,603 | $238,851 | $55,000 | $183,851 |
| 2023 | $2,603 | $238,851 | $55,000 | $183,851 |
| 2022 | $2,700 | $238,851 | $55,000 | $183,851 |
| 2021 | $2,676 | $238,851 | $55,000 | $183,851 |
| 2020 | $2,215 | $187,374 | $30,000 | $157,374 |
| 2019 | $2,237 | $187,374 | $30,000 | $157,374 |
| 2018 | $2,117 | $187,374 | $30,000 | $157,374 |
| 2017 | $2,117 | $187,374 | $30,000 | $157,374 |
| 2016 | $2,051 | $181,515 | $28,000 | $153,515 |
| 2015 | $2,164 | $181,515 | $28,000 | $153,515 |
| 2014 | $1,956 | $181,515 | $28,000 | $153,515 |
Map
- 117 Battery Dr
- 208 Danita Dr
- 117 Danita Dr
- 103 Pine St
- 217 Amber Glen Dr
- 211 Amber Glen Dr
- 225 Amber Glen Dr
- 221 Amber Glen Dr
- 229 Amber Glen Dr
- 205 Amber Glen Dr
- 233 Amber Glen Dr
- 237 Amber Glen Dr
- 201 Amber Glen Dr
- 245 Amber Glen Dr
- 249 Amber Glen Dr
- 253 Amber Glen Dr
- 226 Amber Glen Dr
- 230 Amber Glen Dr
- 257 Amber Glen Dr
- 238 Amber Glen Dr
- 121 Battery Dr
- 113 Battery Dr
- 118 Battery Dr
- 118 Battery Dr Unit 79
- 127 Battery Dr
- 109 Battery Dr Unit 9
- 109 Battery Dr
- 114 Battery Dr
- 124 Battery Dr
- 124 Battery Dr Unit Lot 80
- 92 Battery Dr
- 106 Battery Dr
- 131 Battery Dr
- 128 Battery Dr
- 103 Battery Dr
- 000 Battery Dr
- 297 Maple St
- 148 Poplar St
- 146 Poplar St
- 132 Battery Dr
Ask me questions while you tour the home.