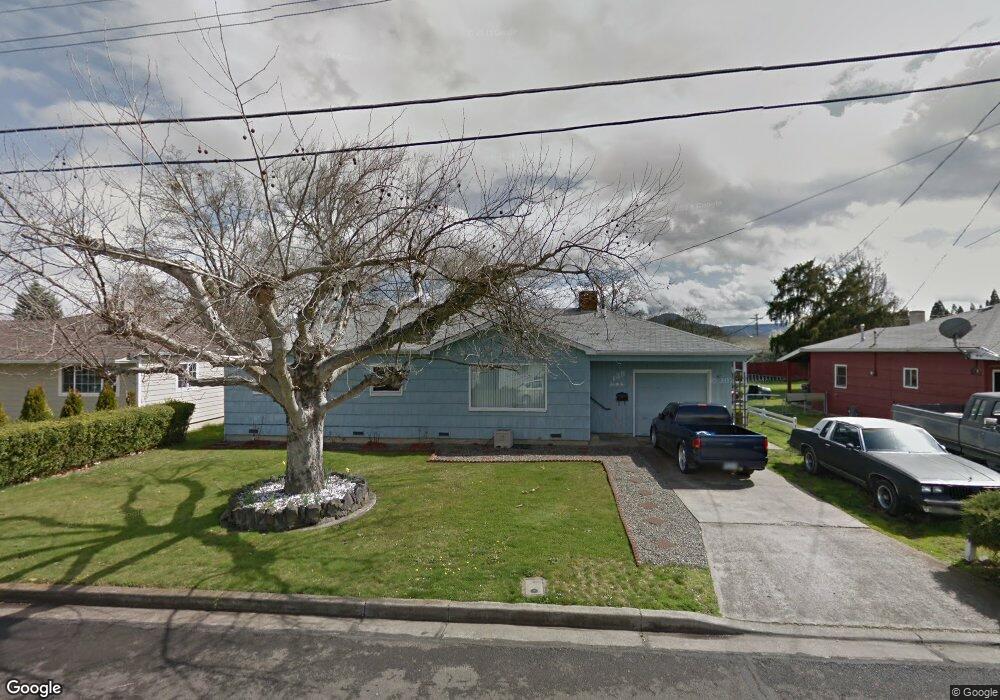
135 Bigham Dr Central Point, OR 97502
Estimated Value: $293,000 - $323,000
3
Beds
1
Bath
1,080
Sq Ft
$289/Sq Ft
Est. Value
About This Home
This home is located at 135 Bigham Dr, Central Point, OR 97502 and is currently estimated at $311,651, approximately $288 per square foot. 135 Bigham Dr is a home located in Jackson County with nearby schools including Central Point Elementary School, Scenic Middle School, and Crater High School.
Ownership History
Date
Name
Owned For
Owner Type
Purchase Details
Closed on
Dec 27, 2019
Sold by
Gonazalez Salvador Banuelos and Lara Maria Hortencia Banueelos
Bought by
Lara Maria H Banuelos
Current Estimated Value
Home Financials for this Owner
Home Financials are based on the most recent Mortgage that was taken out on this home.
Original Mortgage
$190,400
Outstanding Balance
$167,218
Interest Rate
3.73%
Mortgage Type
New Conventional
Estimated Equity
$144,433
Purchase Details
Closed on
Oct 22, 2015
Sold by
Gonzalez Salvador Banuelos
Bought by
Banuelos Gonzales Salvador Banuelos and Banuelos Lara Maria Hortencia
Purchase Details
Closed on
Aug 1, 2006
Sold by
Smith Thomas H and Smith Patricia B
Bought by
Gonzalez Salvador Banuelos
Home Financials for this Owner
Home Financials are based on the most recent Mortgage that was taken out on this home.
Original Mortgage
$159,000
Interest Rate
6.69%
Mortgage Type
Purchase Money Mortgage
Create a Home Valuation Report for This Property
The Home Valuation Report is an in-depth analysis detailing your home's value as well as a comparison with similar homes in the area
Purchase History
| Date | Buyer | Sale Price | Title Company |
|---|---|---|---|
| Lara Maria H Banuelos | -- | Amerititle | |
| Banuelos Gonzales Salvador Banuelos | -- | Accommodation | |
| Gonzalez Salvador Banuelos | $212,000 | Amerititle |
Source: Public Records
Mortgage History
| Date | Status | Borrower | Loan Amount |
|---|---|---|---|
| Open | Lara Maria H Banuelos | $190,400 | |
| Closed | Gonzalez Salvador Banuelos | $159,000 |
Source: Public Records
Tax History
| Year | Tax Paid | Tax Assessment Tax Assessment Total Assessment is a certain percentage of the fair market value that is determined by local assessors to be the total taxable value of land and additions on the property. | Land | Improvement |
|---|---|---|---|---|
| 2026 | $2,655 | $160,430 | -- | -- |
| 2025 | $2,590 | $155,760 | $72,440 | $83,320 |
| 2024 | $2,590 | $151,230 | $70,330 | $80,900 |
| 2023 | $2,506 | $146,830 | $68,290 | $78,540 |
| 2022 | $2,448 | $146,830 | $68,290 | $78,540 |
| 2021 | $2,378 | $142,560 | $66,300 | $76,260 |
| 2020 | $2,309 | $138,410 | $64,370 | $74,040 |
| 2019 | $2,252 | $130,470 | $60,670 | $69,800 |
| 2018 | $2,183 | $126,670 | $58,900 | $67,770 |
| 2017 | $2,128 | $126,670 | $58,900 | $67,770 |
| 2016 | $2,052 | $119,410 | $55,520 | $63,890 |
| 2015 | $1,853 | $113,910 | $45,800 | $68,110 |
| 2014 | $1,754 | $107,260 | $42,410 | $64,850 |
Source: Public Records
Map
Nearby Homes
- 350 Alder St
- 144 N 5th St
- 555 Freeman Rd Unit 73
- 555 Freeman Rd Unit 254
- 555 Freeman Rd Unit 105
- 555 Freeman Rd Unit 209
- 301 Freeman Rd Unit 30
- 301 Freeman Rd Unit 92
- 301 Freeman Rd Unit 91
- 220 S 3rd St
- 731 Maple St
- 331 N 8th St
- 348 N 6th St
- 114 Cedar St
- 230 Peninger Rd
- 833 Hazel St
- 755 S 4th St
- 1600 E Pine St
- 342 Hazel St
- 185 Logan Ave
Your Personal Tour Guide
Ask me questions while you tour the home.