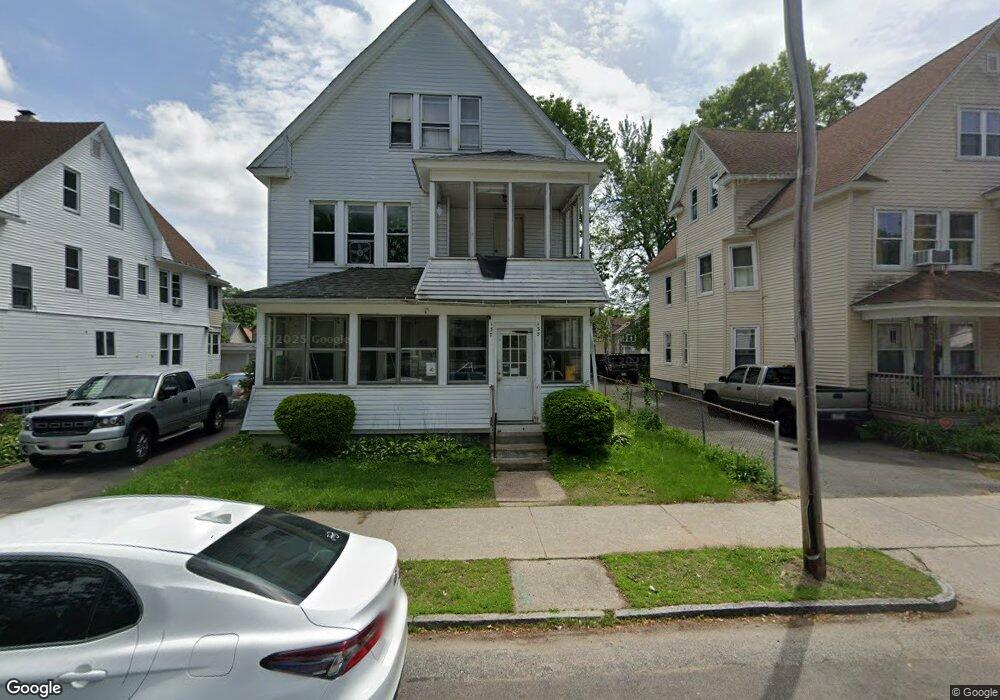
135 Bloomfield St Unit 137 Springfield, MA 01108
Forest Park NeighborhoodEstimated Value: $394,582 - $433,000
9
Beds
2
Baths
3,264
Sq Ft
$128/Sq Ft
Est. Value
About This Home
This home is located at 135 Bloomfield St Unit 137, Springfield, MA 01108 and is currently estimated at $416,646, approximately $127 per square foot. 135 Bloomfield St Unit 137 is a home located in Hampden County with nearby schools including White Street Elementary School, Forest Park Middle School, and High School Of Commerce.
Ownership History
Date
Name
Owned For
Owner Type
Purchase Details
Closed on
Jul 28, 2017
Sold by
Council Viviana
Bought by
Newkirk Eric
Current Estimated Value
Home Financials for this Owner
Home Financials are based on the most recent Mortgage that was taken out on this home.
Original Mortgage
$93,750
Outstanding Balance
$77,174
Interest Rate
3.91%
Mortgage Type
New Conventional
Estimated Equity
$339,472
Purchase Details
Closed on
Jun 27, 2014
Sold by
Slosek Charles P
Bought by
Council Viviana
Home Financials for this Owner
Home Financials are based on the most recent Mortgage that was taken out on this home.
Original Mortgage
$60,000
Interest Rate
4.19%
Mortgage Type
New Conventional
Purchase Details
Closed on
Apr 2, 2014
Sold by
Council Jr Marvin
Bought by
Council Viviana and Slosek Charles P
Create a Home Valuation Report for This Property
The Home Valuation Report is an in-depth analysis detailing your home's value as well as a comparison with similar homes in the area
Home Values in the Area
Average Home Value in this Area
Purchase History
| Date | Buyer | Sale Price | Title Company |
|---|---|---|---|
| Newkirk Eric | $125,000 | -- | |
| Council Viviana | $20,000 | -- | |
| Council Viviana | $20,000 | -- | |
| Council Viviana | $20,000 | -- |
Source: Public Records
Mortgage History
| Date | Status | Borrower | Loan Amount |
|---|---|---|---|
| Open | Newkirk Eric | $93,750 | |
| Previous Owner | Council Viviana | $60,000 |
Source: Public Records
Tax History
| Year | Tax Paid | Tax Assessment Tax Assessment Total Assessment is a certain percentage of the fair market value that is determined by local assessors to be the total taxable value of land and additions on the property. | Land | Improvement |
|---|---|---|---|---|
| 2025 | $4,684 | $298,700 | $31,200 | $267,500 |
| 2024 | $3,117 | $194,100 | $31,200 | $162,900 |
| 2023 | $2,888 | $169,400 | $28,400 | $141,000 |
| 2022 | $3,267 | $173,600 | $26,500 | $147,100 |
| 2021 | $2,967 | $157,000 | $24,100 | $132,900 |
| 2020 | $2,545 | $130,300 | $24,100 | $106,200 |
| 2019 | $2,397 | $121,800 | $24,100 | $97,700 |
| 2018 | $2,505 | $127,300 | $24,100 | $103,200 |
| 2017 | $2,359 | $120,000 | $22,600 | $97,400 |
| 2016 | $1,938 | $98,600 | $22,600 | $76,000 |
| 2015 | $1,977 | $100,500 | $22,600 | $77,900 |
Source: Public Records
Map
Nearby Homes
- 141 Bloomfield St Unit 143
- 131 Bloomfield St Unit 133
- 141-143 Bloomfield St
- 125 Bloomfield St Unit 127
- 70 Ranney St Unit 72
- 70-72 Ranney St
- 134 Johnson St Unit 136
- 66 Ranney St Unit 68
- 140 Johnson St Unit 142
- 76 Ranney St Unit 78
- 130 Johnson St Unit 132
- 130-132 Johnson St
- 134 Johnson St
- 119 Bloomfield St Unit 121
- 82 Ranney St Unit 84
- 82-84 Ranney St
- 124 Johnson St Unit 126
- 138 Bloomfield St
- 132 Bloomfield St Unit 134
- 142 Bloomfield St Unit 144
Your Personal Tour Guide
Ask me questions while you tour the home.