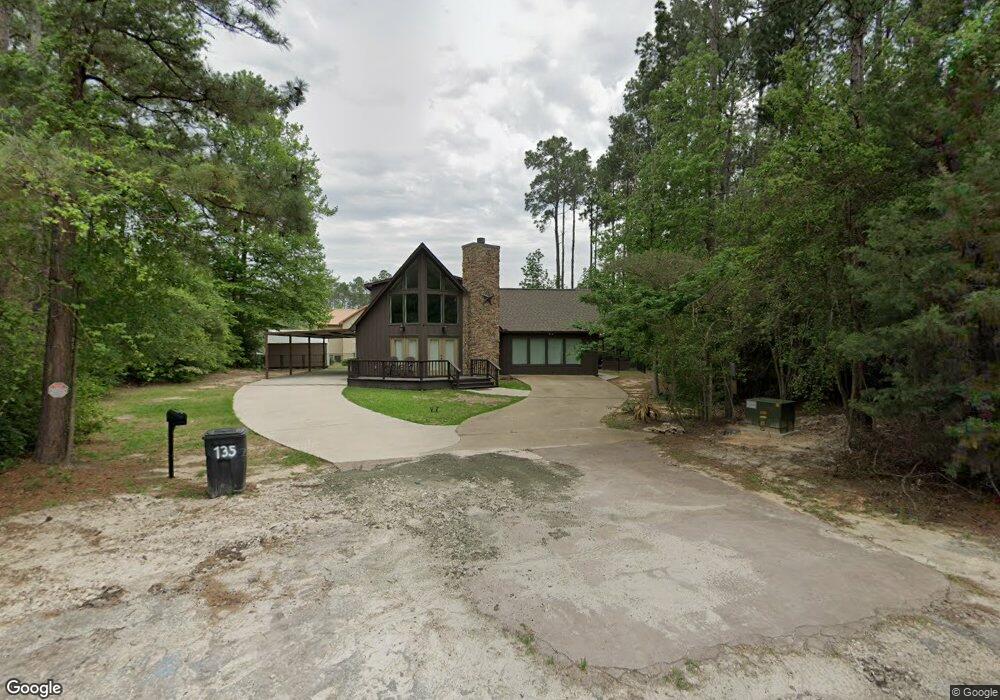
135 Boxwood Ct Unit Section 12, Lot 3, R Brookeland, TX 75931
Estimated Value: $390,000 - $438,000
3
Beds
2
Baths
1,768
Sq Ft
$233/Sq Ft
Est. Value
About This Home
This home is located at 135 Boxwood Ct Unit Section 12, Lot 3, R, Brookeland, TX 75931 and is currently estimated at $411,218, approximately $232 per square foot. 135 Boxwood Ct Unit Section 12, Lot 3, R is a home located in Jasper County with nearby schools including Brookeland Elementary School and Brookeland High School.
Ownership History
Date
Name
Owned For
Owner Type
Purchase Details
Closed on
May 1, 2023
Sold by
Scott Lance
Bought by
Lackey Sandra and Lackey Roy
Current Estimated Value
Home Financials for this Owner
Home Financials are based on the most recent Mortgage that was taken out on this home.
Original Mortgage
$130,000
Outstanding Balance
$126,521
Interest Rate
6.6%
Mortgage Type
New Conventional
Estimated Equity
$284,697
Purchase Details
Closed on
Mar 26, 2014
Sold by
Allen Toshia
Bought by
Scott Lance
Home Financials for this Owner
Home Financials are based on the most recent Mortgage that was taken out on this home.
Original Mortgage
$159,125
Interest Rate
4.32%
Mortgage Type
New Conventional
Purchase Details
Closed on
Feb 18, 2011
Sold by
Rayburn Country Redevelopment Llc
Bought by
Allen Toshia
Create a Home Valuation Report for This Property
The Home Valuation Report is an in-depth analysis detailing your home's value as well as a comparison with similar homes in the area
Home Values in the Area
Average Home Value in this Area
Purchase History
| Date | Buyer | Sale Price | Title Company |
|---|---|---|---|
| Lackey Sandra | -- | None Listed On Document | |
| Scott Lance | -- | None Available | |
| Allen Toshia | -- | None Available |
Source: Public Records
Mortgage History
| Date | Status | Borrower | Loan Amount |
|---|---|---|---|
| Open | Lackey Sandra | $130,000 | |
| Previous Owner | Scott Lance | $159,125 |
Source: Public Records
Tax History Compared to Growth
Tax History
| Year | Tax Paid | Tax Assessment Tax Assessment Total Assessment is a certain percentage of the fair market value that is determined by local assessors to be the total taxable value of land and additions on the property. | Land | Improvement |
|---|---|---|---|---|
| 2024 | $60 | $449,553 | $31,485 | $418,068 |
| 2023 | $4,545 | $327,693 | $30,274 | $297,419 |
| 2022 | $4,103 | $314,031 | $30,274 | $283,757 |
| 2021 | $3,903 | $245,446 | $35,000 | $210,446 |
| 2020 | $3,548 | $204,717 | $35,000 | $169,717 |
| 2019 | $3,639 | $204,717 | $35,000 | $169,717 |
| 2018 | $3,396 | $180,861 | $35,000 | $145,861 |
| 2017 | $3,396 | $180,861 | $35,000 | $145,861 |
| 2016 | $3,399 | $180,861 | $35,000 | $145,861 |
| 2015 | -- | $170,861 | $25,000 | $145,861 |
| 2014 | -- | $170,861 | $25,000 | $145,861 |
Source: Public Records
Map
Nearby Homes
- 120 Boxwood Ln
- 138 Breezeway Dr
- 130 Boxwood Ln N
- 470 Private Road 6070
- 081 Pr 6026
- 027 Pr 6028
- 36053-36057 Private Road 6075
- 36053-36054 Private Road 6075
- 36055-36057 Private Road 6075
- 194 Brook Ln
- 127 Brook Ln
- 350 Lake Way Dr
- 42 Beachrock Dr
- 41 Beachrock Dr
- 33386,33387 Beachrock Dr
- 33386 Beachrock Dr
- 135 Brushwood Dr
- 147 Brushwood Ct
- 23 Bridle Ct
- 251 Bayview Dr
- 135 Boxwood Ct
- 135 Boxwood Ct
- 1 Boxwood Ct
- 111 Boxwood Ln N
- 1242 Beachrock Dr
- 1242 Beachrock Dr Unit Sec 12 Lot 7
- 113 Beachrock Dr
- Lot 43,44,45 Sec 12 Beachrock
- 132 Boxwood Ct
- 121 Beachrock Dr
- 109 Beachrock Dr
- 109 Beachrock Dr Unit 1464 Beachrock Dr
- 151 Blackoak Ln
- 1281 Beachrock Dr
- 134 Boxwood
- 134 Boxwood Unit Section 12 Lot 134
- 120 Beachrock Dr
- 20 Circle Dr
- 54 Circle Dr
- 165 Black Oak Ln Unit Rayburn Country