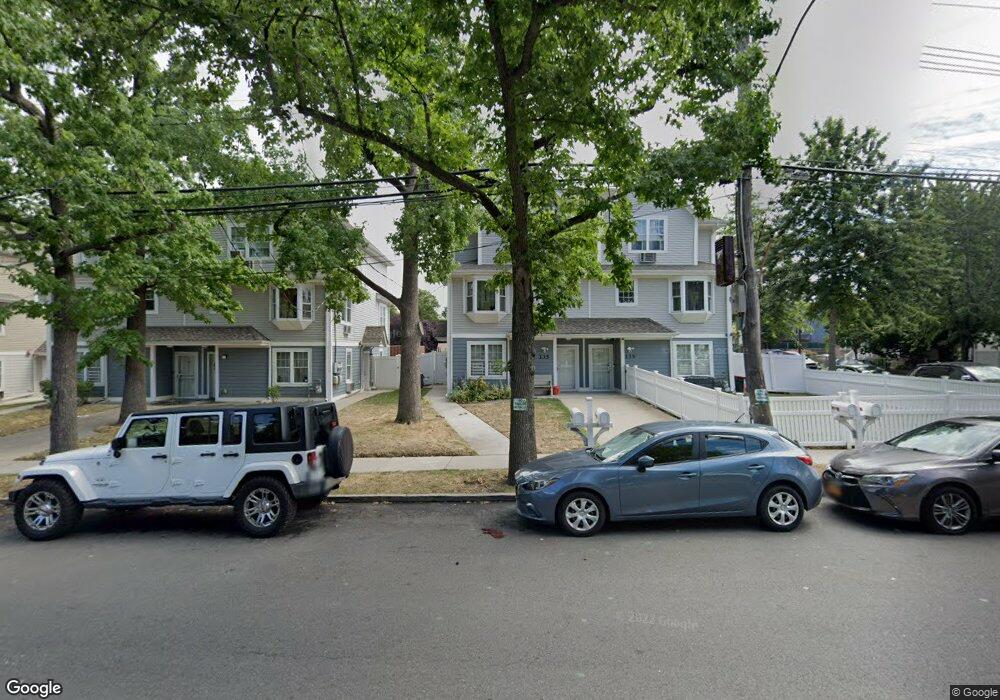
135 Broadway Staten Island, NY 10310
West Brighton NeighborhoodEstimated Value: $545,933 - $882,000
--
Bed
--
Bath
2,040
Sq Ft
$353/Sq Ft
Est. Value
About This Home
This home is located at 135 Broadway, Staten Island, NY 10310 and is currently estimated at $719,733, approximately $352 per square foot. 135 Broadway is a home located in Richmond County with nearby schools including P.S. 18 John G. Whittier, Intermediate School 27, and Susan E Wagner High School.
Ownership History
Date
Name
Owned For
Owner Type
Purchase Details
Closed on
Aug 2, 2010
Sold by
Markham Gardens Housing Development Fund
Bought by
Chapman Natasha
Current Estimated Value
Home Financials for this Owner
Home Financials are based on the most recent Mortgage that was taken out on this home.
Original Mortgage
$245,809
Outstanding Balance
$165,193
Interest Rate
4.87%
Mortgage Type
FHA
Estimated Equity
$554,540
Purchase Details
Closed on
Jun 29, 2007
Sold by
New York City Housing Authority
Bought by
Markham Gardens Housing Development Fund and Markham Homes Lp
Create a Home Valuation Report for This Property
The Home Valuation Report is an in-depth analysis detailing your home's value as well as a comparison with similar homes in the area
Home Values in the Area
Average Home Value in this Area
Purchase History
| Date | Buyer | Sale Price | Title Company |
|---|---|---|---|
| Chapman Natasha | $447,344 | All New York Title Agency In | |
| Markham Gardens Housing Development Fund | -- | None Available |
Source: Public Records
Mortgage History
| Date | Status | Borrower | Loan Amount |
|---|---|---|---|
| Open | Chapman Natasha | $245,809 |
Source: Public Records
Tax History Compared to Growth
Tax History
| Year | Tax Paid | Tax Assessment Tax Assessment Total Assessment is a certain percentage of the fair market value that is determined by local assessors to be the total taxable value of land and additions on the property. | Land | Improvement |
|---|---|---|---|---|
| 2025 | $5,952 | $34,740 | $5,667 | $29,073 |
| 2024 | $5,952 | $31,680 | $6,062 | $25,618 |
| 2023 | $5,778 | $28,449 | $6,245 | $22,204 |
| 2022 | $5,358 | $29,760 | $6,480 | $23,280 |
| 2021 | $5,329 | $25,320 | $6,480 | $18,840 |
| 2020 | $5,365 | $28,920 | $6,480 | $22,440 |
| 2019 | $5,166 | $28,920 | $6,480 | $22,440 |
| 2018 | $4,837 | $23,730 | $5,252 | $18,478 |
| 2017 | $4,564 | $22,387 | $5,409 | $16,978 |
| 2016 | $4,222 | $21,120 | $6,480 | $14,640 |
| 2015 | $3,950 | $21,814 | $5,364 | $16,450 |
| 2014 | $3,950 | $20,580 | $5,400 | $15,180 |
Source: Public Records
Map
Nearby Homes