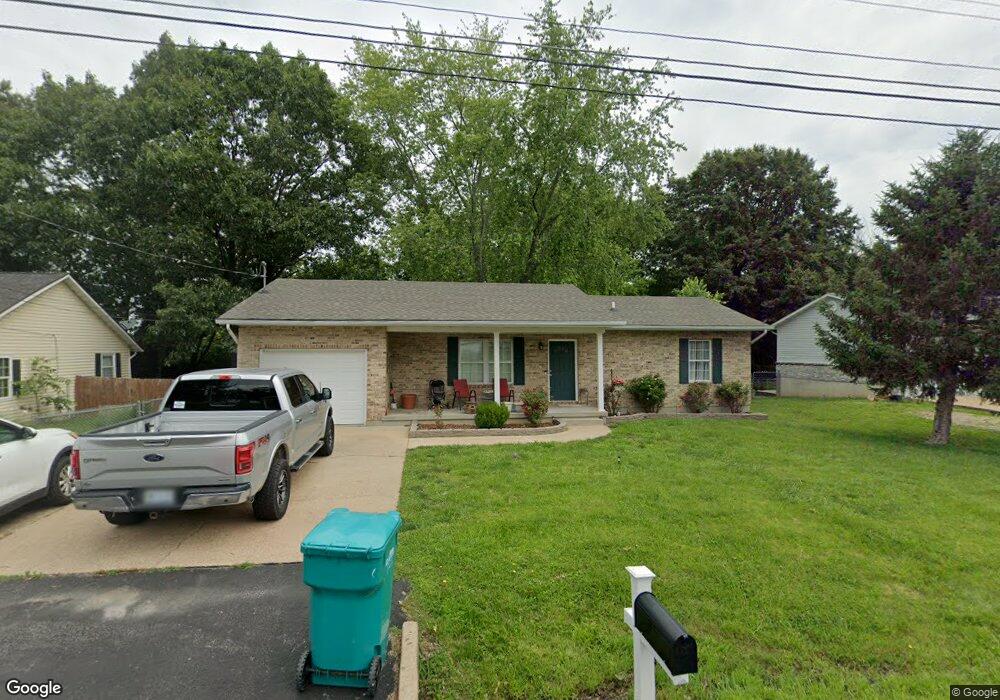
135 Bud St Sullivan, MO 63080
Estimated Value: $176,825 - $196,000
3
Beds
1
Bath
1,075
Sq Ft
$175/Sq Ft
Est. Value
About This Home
This home is located at 135 Bud St, Sullivan, MO 63080 and is currently estimated at $187,942, approximately $174 per square foot. 135 Bud St is a home located in Franklin County with nearby schools including Sullivan Primary School, Sullivan Elementary School, and Sullivan Middle School.
Ownership History
Date
Name
Owned For
Owner Type
Purchase Details
Closed on
Dec 18, 2020
Sold by
Wilson Realty Inc
Bought by
Wilcox Heidi L
Current Estimated Value
Home Financials for this Owner
Home Financials are based on the most recent Mortgage that was taken out on this home.
Original Mortgage
$97,665
Outstanding Balance
$86,750
Interest Rate
2.7%
Mortgage Type
New Conventional
Estimated Equity
$101,192
Purchase Details
Closed on
Feb 20, 2019
Sold by
Hansen Stierberger Downard Sch
Bought by
Wilson Realty Inc
Purchase Details
Closed on
Aug 12, 2008
Sold by
Franklin Financial Corp
Bought by
Kays Gary R
Purchase Details
Closed on
Oct 27, 2006
Sold by
Tweedy Ray and Tweedy Raymond
Bought by
Franlin Financial Corp
Home Financials for this Owner
Home Financials are based on the most recent Mortgage that was taken out on this home.
Original Mortgage
$23,200
Interest Rate
6.28%
Mortgage Type
Seller Take Back
Create a Home Valuation Report for This Property
The Home Valuation Report is an in-depth analysis detailing your home's value as well as a comparison with similar homes in the area
Home Values in the Area
Average Home Value in this Area
Purchase History
| Date | Buyer | Sale Price | Title Company |
|---|---|---|---|
| Wilcox Heidi L | -- | None Available | |
| Wilson Realty Inc | $88,500 | None Available | |
| Kays Gary R | -- | None Available | |
| Franlin Financial Corp | $65,801 | None Available | |
| Tweedy Raymond | -- | None Available |
Source: Public Records
Mortgage History
| Date | Status | Borrower | Loan Amount |
|---|---|---|---|
| Open | Wilcox Heidi L | $97,665 | |
| Previous Owner | Tweedy Raymond | $23,200 | |
| Closed | Kays Gary R | $0 |
Source: Public Records
Tax History
| Year | Tax Paid | Tax Assessment Tax Assessment Total Assessment is a certain percentage of the fair market value that is determined by local assessors to be the total taxable value of land and additions on the property. | Land | Improvement |
|---|---|---|---|---|
| 2025 | $1,656 | $26,737 | $0 | $0 |
| 2024 | $1,656 | $23,168 | $0 | $0 |
| 2023 | $1,346 | $23,168 | $0 | $0 |
| 2022 | $1,357 | $23,406 | $0 | $0 |
| 2021 | $1,365 | $23,406 | $0 | $0 |
| 2020 | $1,247 | $20,970 | $0 | $0 |
| 2019 | $1,248 | $20,970 | $0 | $0 |
| 2018 | $1,171 | $19,433 | $0 | $0 |
| 2017 | $1,181 | $19,433 | $0 | $0 |
| 2016 | $1,160 | $19,304 | $0 | $0 |
| 2015 | $1,163 | $19,304 | $0 | $0 |
| 2014 | $1,137 | $19,484 | $0 | $0 |
Source: Public Records
Map
Nearby Homes
Your Personal Tour Guide
Ask me questions while you tour the home.