
Estimated payment $5,688/month
Highlights
- Popular Property
- Traditional Architecture
- Main Floor Primary Bedroom
- Private Lot
- Wood Flooring
- Loft
About This Home
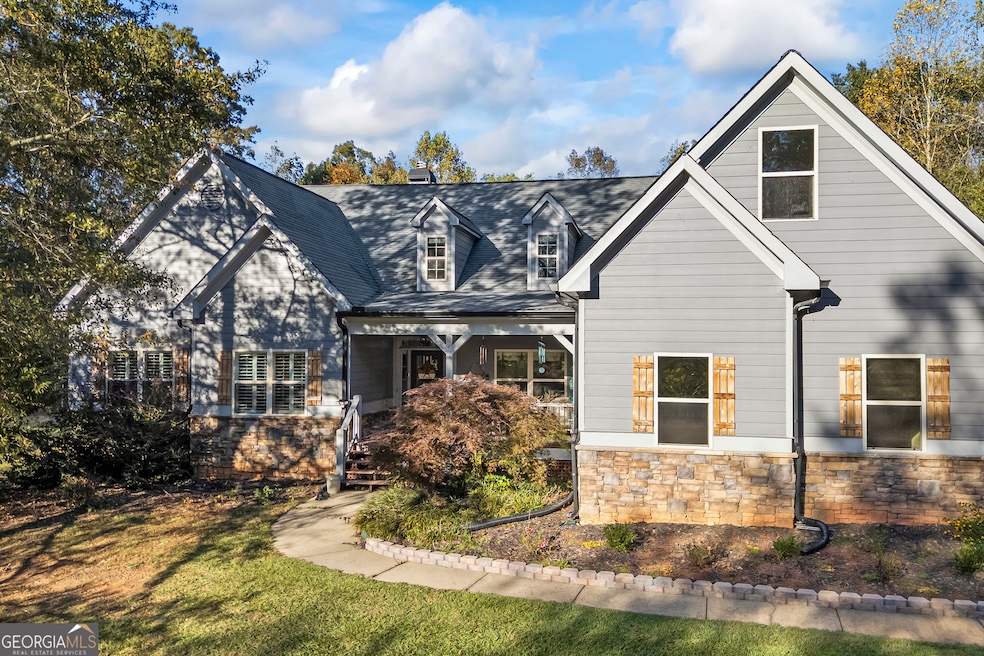
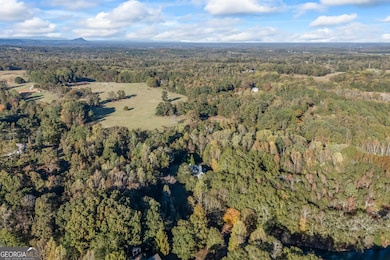
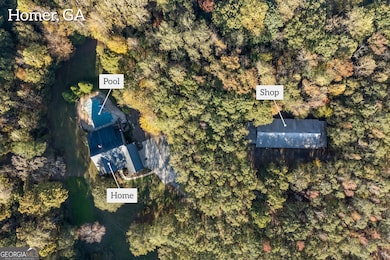
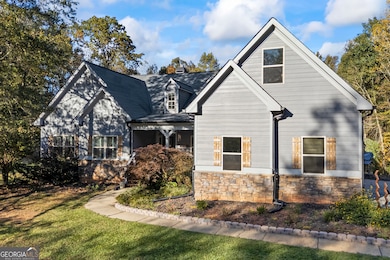
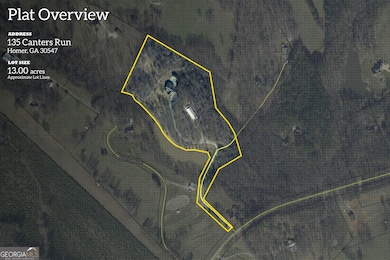
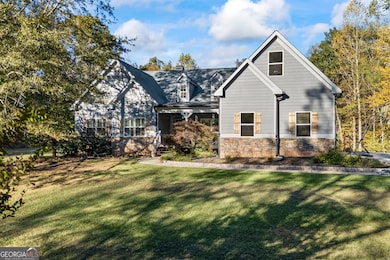
Welcome home to this secluded 5-bedroom, 4.5-bath estate tucked away on approximately 13 beautiful acres. Perfect for those who crave the serenity of country living, this property offers wide-open space, privacy, and a true connection to nature. The home features a finished basement with a full kitchen, perfect for a mother-in-law suite, guest space, or weekend visitors. A detached shop with five roll-up doors provides plenty of room for farm equipment, vehicles, or your next big project. Spend your days relaxing by the pool, exploring your land, or enjoying peaceful moments by the creek that borders the back of the property. There's even ample space to plant your own garden and harvest fresh produce right at home, embracing a true farm-to-table lifestyle. With both public water and a fully functional well (75 gallons/minute), plus a powerful 40kW generator capable of running the home and shop when needed, you'll enjoy peace of mind and self-sufficient living without sacrificing modern comforts. Whether you dream of a small homestead, a private family retreat, or simply a place to slow down and savor the quiet-this property has it all. Come experience the charm and freedom of country living at its best!
Open House Schedule
-
Saturday, November 15, 202511:00 am to 2:00 pm11/15/2025 11:00:00 AM +00:0011/15/2025 2:00:00 PM +00:00Join us for an Open House at 135 Canters Run in Homer, GA! Nestled on 13 acres of privacy with beautiful views, this spacious and beautifully maintained home offers a bright, open layout, fresh updates, and plenty of room to grow. Enjoy comfortable living areas, a welcoming kitchen, and peaceful outdoor spaces that showcase the property's serene setting. Agents and buyers-don't miss the chance to tour this move-in-ready retreat and experience everything it has to offer!Add to Calendar
Home Details
Home Type
- Single Family
Est. Annual Taxes
- $5,020
Year Built
- Built in 2006
Lot Details
- 13.02 Acre Lot
- Private Lot
- Level Lot
- Open Lot
Home Design
- Traditional Architecture
- Composition Roof
- Wood Siding
Interior Spaces
- 3-Story Property
- 1 Fireplace
- Home Office
- Loft
- Laundry in Mud Room
Kitchen
- Double Oven
- Cooktop
- Microwave
- Dishwasher
- Disposal
Flooring
- Wood
- Carpet
- Tile
Bedrooms and Bathrooms
- 5 Bedrooms | 3 Main Level Bedrooms
- Primary Bedroom on Main
- Walk-In Closet
- In-Law or Guest Suite
- Soaking Tub
- Bathtub Includes Tile Surround
Finished Basement
- Basement Fills Entire Space Under The House
- Interior and Exterior Basement Entry
- Finished Basement Bathroom
Parking
- Parking Pad
- Parking Shed
Schools
- Banks Co Primary/Elementary School
- Banks County Middle School
- Banks County High School
Utilities
- Central Heating and Cooling System
- Well
- Septic Tank
Community Details
- No Home Owners Association
Map
Home Values in the Area
Average Home Value in this Area
Tax History
| Year | Tax Paid | Tax Assessment Tax Assessment Total Assessment is a certain percentage of the fair market value that is determined by local assessors to be the total taxable value of land and additions on the property. | Land | Improvement |
|---|---|---|---|---|
| 2025 | $3,761 | $266,511 | $61,585 | $204,926 |
| 2024 | $4,262 | $254,766 | $55,986 | $198,780 |
| 2023 | $3,611 | $214,024 | $52,080 | $161,944 |
| 2022 | $3,212 | $185,568 | $40,766 | $144,802 |
| 2021 | $3,146 | $167,866 | $33,972 | $133,894 |
| 2020 | $3,304 | $163,493 | $24,783 | $138,710 |
| 2019 | $3,217 | $163,098 | $24,388 | $138,710 |
| 2018 | $3,053 | $153,896 | $24,388 | $129,508 |
| 2017 | $3,164 | $146,222 | $17,468 | $128,754 |
| 2016 | $2,697 | $124,129 | $17,468 | $106,661 |
| 2015 | $2,805 | $135,862 | $17,468 | $118,394 |
| 2014 | $2,805 | $136,928 | $18,534 | $118,394 |
| 2013 | -- | $136,928 | $18,533 | $118,394 |
Property History
| Date | Event | Price | List to Sale | Price per Sq Ft |
|---|---|---|---|---|
| 11/04/2025 11/04/25 | For Sale | $999,990 | -- | $172 / Sq Ft |
Purchase History
| Date | Type | Sale Price | Title Company |
|---|---|---|---|
| Deed | $240,000 | -- | |
| Interfamily Deed Transfer | -- | -- | |
| Deed | $330,000 | -- | |
| Deed | $318,676 | -- |
Mortgage History
| Date | Status | Loan Amount | Loan Type |
|---|---|---|---|
| Previous Owner | $313,500 | New Conventional |
Source: Georgia MLS
MLS Number: 10636158
APN: B61-052F
Disclaimer: Certain information contained herein is derived from information provided by parties other than Homes.com. All information provided is deemed reliable, but is not guaranteed to be accurate and should be independently verified.
![]() The data relating to real estate for sale on this web site comes in part from the Broker Reciprocity Program of Georgia MLS. Real estate listings held by brokerage firms other than Redfin are marked with the Broker Reciprocity logo and detailed information about them includes the name of the listing brokers. Information deemed reliable but not guaranteed. Copyright 2025 Georgia MLS. All rights reserved.
The data relating to real estate for sale on this web site comes in part from the Broker Reciprocity Program of Georgia MLS. Real estate listings held by brokerage firms other than Redfin are marked with the Broker Reciprocity logo and detailed information about them includes the name of the listing brokers. Information deemed reliable but not guaranteed. Copyright 2025 Georgia MLS. All rights reserved.
- 2205 Highway 51 N
- 127 Mayfield Rd
- 108 Indigo Cir
- 152 Charity Dr
- 160 Greenview Ct
- 365 Greenview Ct
- 176 Greenview Ct
- 1313 Damascus Rd
- 168 Greenview Ct
- 164 Greenview Ct
- 368 Greenview Ct
- 174 Greenview Ct
- 366 Charity Rd
- 152 Lois Ln
- 716 Hawkins Rd
- 143 Lois Ln
- 0 Bennett Rd Unit 23200799
- 4638 Highway 63
- 146 Wild Turkey Pass
- 165 Sweet Briar Way
- 2769 Samples Scales Rd
- 2785 Samples Scales Rd
- 297 Forrester Rd
- 109 Capstone Way
- 322 Beaver Creek Dr
- 1769 Duncan Rd
- 199 W W Gary Rd
- 100 Crossing Place
- 5486 Mt Olive Rd Unit ID1302835P
- 150 Adaline Ct
- 153 Adaline Ct
- 143 Adaline Ct
- 2446 Remington Dr
- 2446 Remington Dr
- 9 Nolana Dr Unit Mitchell
- 9 Nolana Dr Unit Harding
- 9 Nolana Dr Unit Greenfield
- 110 Heritage Garden Dr
- 878 Hospital Rd
