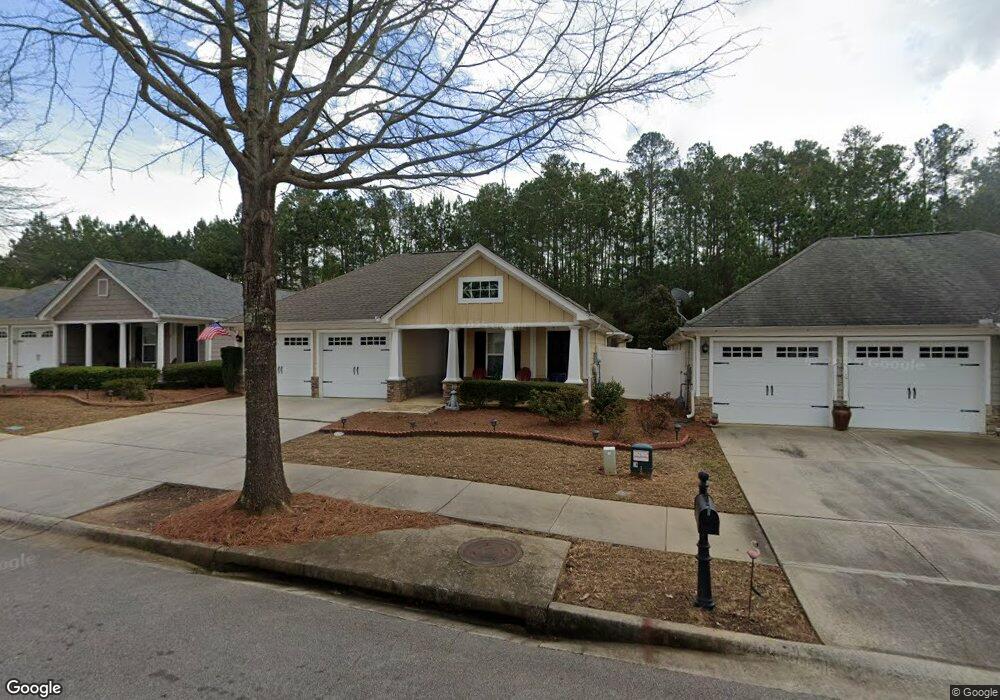
135 Cottage Club Dr Unit 50 Locust Grove, GA 30248
Spalding County NeighborhoodEstimated Value: $324,538 - $368,000
3
Beds
3
Baths
2,109
Sq Ft
$165/Sq Ft
Est. Value
About This Home
This home is located at 135 Cottage Club Dr Unit 50, Locust Grove, GA 30248 and is currently estimated at $347,135, approximately $164 per square foot. 135 Cottage Club Dr Unit 50 is a home located in Spalding County with nearby schools including Jordan Hill Road Elementary School, Kennedy Road Middle School, and Spalding High School.
Ownership History
Date
Name
Owned For
Owner Type
Purchase Details
Closed on
Jun 10, 2019
Sold by
Reid D Michael
Bought by
Yancey Teresa A
Current Estimated Value
Home Financials for this Owner
Home Financials are based on the most recent Mortgage that was taken out on this home.
Original Mortgage
$223,870
Outstanding Balance
$197,427
Interest Rate
4.25%
Mortgage Type
FHA
Estimated Equity
$149,708
Purchase Details
Closed on
Jun 28, 2018
Sold by
Ashbaugh Owen C
Bought by
Michael Reid D and Reid Sandi K
Purchase Details
Closed on
Mar 31, 2014
Sold by
Reeves Michael H
Bought by
Ashbaugh Owen C and Ashbaugh Cara Lou
Purchase Details
Closed on
Mar 20, 2006
Sold by
Windsong Prop Llc
Bought by
Reeves Michael H and Reeves Maty A
Home Financials for this Owner
Home Financials are based on the most recent Mortgage that was taken out on this home.
Original Mortgage
$165,550
Interest Rate
6.19%
Mortgage Type
New Conventional
Create a Home Valuation Report for This Property
The Home Valuation Report is an in-depth analysis detailing your home's value as well as a comparison with similar homes in the area
Home Values in the Area
Average Home Value in this Area
Purchase History
| Date | Buyer | Sale Price | Title Company |
|---|---|---|---|
| Yancey Teresa A | $228,000 | -- | |
| Michael Reid D | $199,000 | -- | |
| Ashbaugh Owen C | $148,000 | -- | |
| Reeves Michael H | $207,000 | -- |
Source: Public Records
Mortgage History
| Date | Status | Borrower | Loan Amount |
|---|---|---|---|
| Open | Yancey Teresa A | $223,870 | |
| Previous Owner | Reeves Michael H | $165,550 |
Source: Public Records
Tax History Compared to Growth
Tax History
| Year | Tax Paid | Tax Assessment Tax Assessment Total Assessment is a certain percentage of the fair market value that is determined by local assessors to be the total taxable value of land and additions on the property. | Land | Improvement |
|---|---|---|---|---|
| 2024 | $4,489 | $126,214 | $16,000 | $110,214 |
| 2023 | $4,489 | $126,214 | $16,000 | $110,214 |
| 2022 | $3,799 | $105,212 | $14,000 | $91,212 |
| 2021 | $3,162 | $87,702 | $14,000 | $73,702 |
| 2020 | $3,151 | $87,093 | $14,000 | $73,093 |
| 2019 | $2,978 | $78,954 | $14,000 | $64,954 |
| 2018 | $1,760 | $63,569 | $14,000 | $49,569 |
| 2017 | $1,557 | $59,655 | $14,000 | $45,655 |
| 2016 | $1,336 | $53,133 | $14,000 | $39,133 |
| 2015 | $1,384 | $53,133 | $14,000 | $39,133 |
| 2014 | $2,151 | $53,993 | $14,000 | $39,993 |
Source: Public Records
Map
Nearby Homes
- 358 Southgate Dr
- 150 Cottage Club Dr
- 1496 Trestle Rd
- 156 Cottage Club Dr
- 250 High Court Way
- 164 Cottage Club Dr
- 5001 Wolverine Place
- 411 Johnson
- 1141 Pebble Creek Ln
- 1143 Pebble Creek Ln
- 5200 Heron Bay Blvd
- 1731 Panorama Dr
- 1603 Falcon Ct
- 214 Georgian Way
- 6025 Golf View Crossing
- 119 Bantry Way
- 1528 Windward Dr
- 6409 Caledon Ct
- 112 Leveret Rd
- 1429 Kentmire Ct
- 135 Cottage Club Dr
- 133 Cottage Club Dr
- 137 Cottage Club Dr
- 131 Cottage Club Dr
- 139 Cottage Club Dr
- 129 Cottage Club Dr
- 141 Cottage Club Dr
- 0 Cottage Club Dr Unit 8010782
- 0 Cottage Club Dr Unit 7153489
- 0 Cottage Club Dr Unit 8947339
- 0 Cottage Club Dr Unit 8785353
- 0 Cottage Club Dr Unit 8873729
- 0 Cottage Club Dr Unit 8889373
- 0 Cottage Club Dr Unit 3182938
- 0 Cottage Club Dr Unit 7438589
- 0 Cottage Club Dr Unit 8134656
- 0 Cottage Club Dr Unit 8172511
- 0 Cottage Club Dr Unit 8262204
- 143 Cottage Club Dr
- 127 Cottage Club Dr