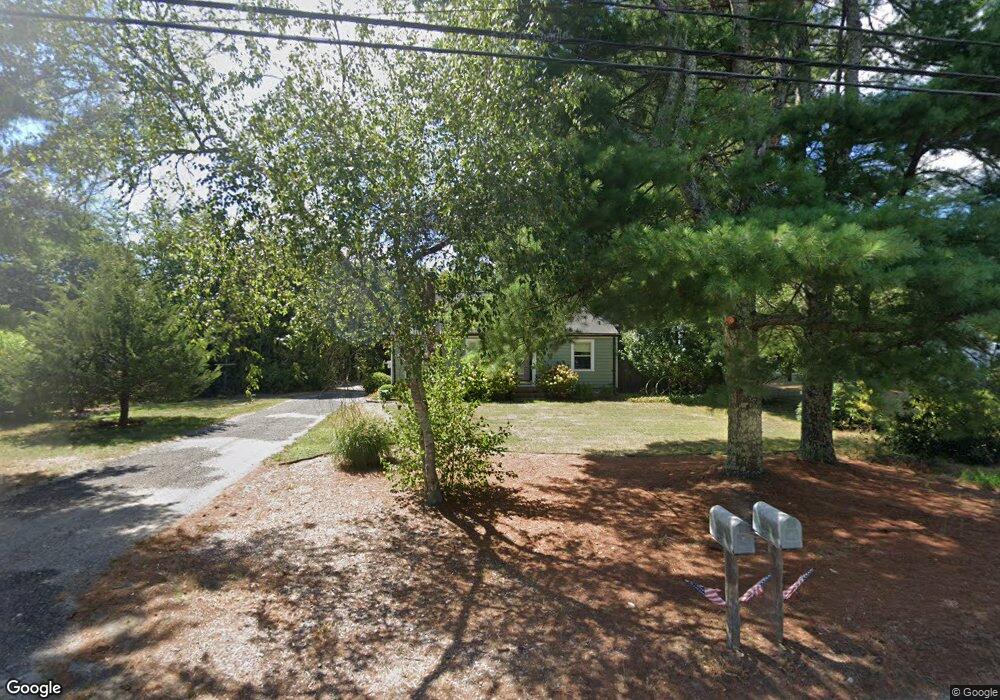
135 County Rd East Freetown, MA 02717
Estimated Value: $477,000 - $487,120
2
Beds
1
Bath
1,372
Sq Ft
$351/Sq Ft
Est. Value
About This Home
This home is located at 135 County Rd, East Freetown, MA 02717 and is currently estimated at $481,780, approximately $351 per square foot. 135 County Rd is a home located in Bristol County with nearby schools including Freetown Elementary School, George R Austin Intermediate School, and Freetown-Lakeville Middle School.
Ownership History
Date
Name
Owned For
Owner Type
Purchase Details
Closed on
May 10, 2018
Sold by
Padelford Patricia
Bought by
Dupuis Melanie P and Padelford Richard L
Current Estimated Value
Home Financials for this Owner
Home Financials are based on the most recent Mortgage that was taken out on this home.
Original Mortgage
$200,000
Outstanding Balance
$172,365
Interest Rate
4.44%
Mortgage Type
New Conventional
Estimated Equity
$309,415
Purchase Details
Closed on
Sep 24, 2004
Sold by
Young Maureen M
Bought by
Padelford Patricia
Home Financials for this Owner
Home Financials are based on the most recent Mortgage that was taken out on this home.
Original Mortgage
$244,000
Interest Rate
5.89%
Mortgage Type
Purchase Money Mortgage
Purchase Details
Closed on
Jul 11, 1988
Sold by
Young Blaine L
Bought by
Young Maureen M
Create a Home Valuation Report for This Property
The Home Valuation Report is an in-depth analysis detailing your home's value as well as a comparison with similar homes in the area
Home Values in the Area
Average Home Value in this Area
Purchase History
| Date | Buyer | Sale Price | Title Company |
|---|---|---|---|
| Dupuis Melanie P | $250,000 | -- | |
| Dupuis Melanie P | $250,000 | -- | |
| Padelford Patricia | $305,000 | -- | |
| Padelford Patricia | $305,000 | -- | |
| Young Maureen M | $40,000 | -- |
Source: Public Records
Mortgage History
| Date | Status | Borrower | Loan Amount |
|---|---|---|---|
| Open | Dupuis Melanie P | $200,000 | |
| Closed | Dupuis Melanie P | $200,000 | |
| Previous Owner | Young Maureen M | $244,000 | |
| Previous Owner | Young Maureen M | $120,000 |
Source: Public Records
Tax History Compared to Growth
Tax History
| Year | Tax Paid | Tax Assessment Tax Assessment Total Assessment is a certain percentage of the fair market value that is determined by local assessors to be the total taxable value of land and additions on the property. | Land | Improvement |
|---|---|---|---|---|
| 2025 | $3,958 | $399,400 | $170,700 | $228,700 |
| 2024 | $3,932 | $377,000 | $161,000 | $216,000 |
| 2023 | $3,796 | $354,400 | $145,000 | $209,400 |
| 2022 | $3,630 | $301,000 | $122,900 | $178,100 |
| 2021 | $3,423 | $269,500 | $111,700 | $157,800 |
| 2020 | $3,291 | $252,800 | $101,800 | $151,000 |
| 2019 | $3,124 | $237,600 | $96,900 | $140,700 |
| 2018 | $2,985 | $224,300 | $96,900 | $127,400 |
| 2017 | $2,916 | $218,900 | $96,900 | $122,000 |
| 2016 | $2,960 | $226,100 | $104,600 | $121,500 |
| 2015 | $2,890 | $224,000 | $104,600 | $119,400 |
| 2014 | $2,543 | $201,700 | $102,400 | $99,300 |
Source: Public Records
Map
Nearby Homes