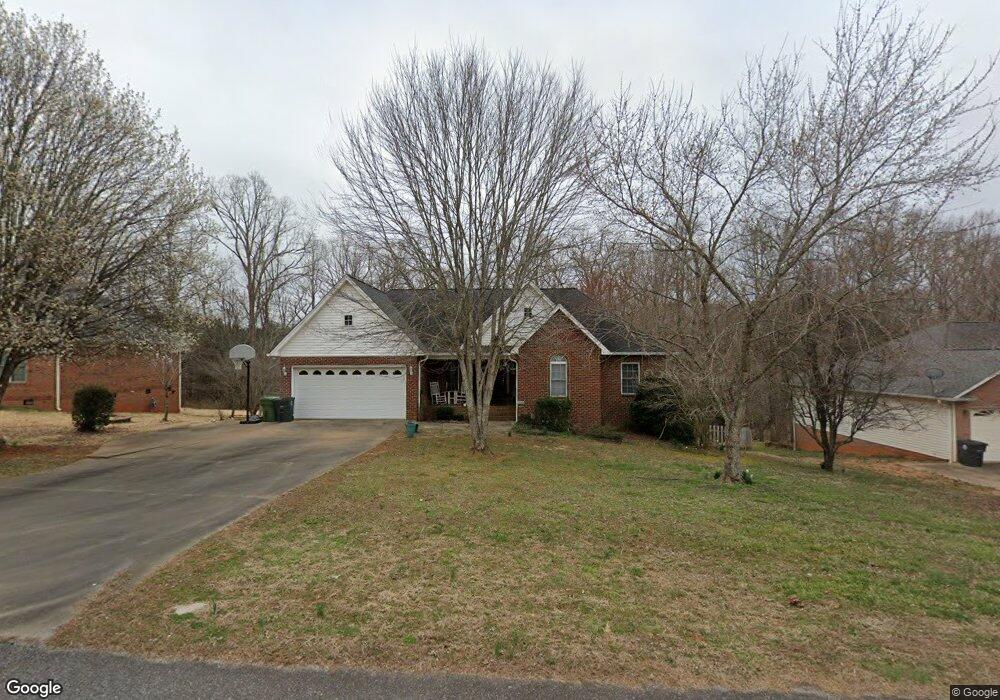
135 Creekside Dr Shelby, NC 28152
Estimated Value: $320,000 - $370,000
4
Beds
3
Baths
2,997
Sq Ft
$116/Sq Ft
Est. Value
About This Home
This home is located at 135 Creekside Dr, Shelby, NC 28152 and is currently estimated at $346,402, approximately $115 per square foot. 135 Creekside Dr is a home located in Cleveland County with nearby schools including Boiling Springs Elementary School, Crest Middle School, and Crest High School.
Ownership History
Date
Name
Owned For
Owner Type
Purchase Details
Closed on
Nov 13, 2017
Sold by
Hartman Jeffrey and Hartman Shana
Bought by
Beam Alan C and Beam Lacey F
Current Estimated Value
Home Financials for this Owner
Home Financials are based on the most recent Mortgage that was taken out on this home.
Original Mortgage
$198,000
Outstanding Balance
$166,177
Interest Rate
3.91%
Mortgage Type
New Conventional
Estimated Equity
$180,225
Purchase Details
Closed on
Oct 26, 2009
Sold by
Hartman Sara M
Bought by
Hartman Jeffrey M
Purchase Details
Closed on
Jun 8, 2005
Sold by
Walsh James J and Advienne Walsh G
Bought by
Hartman Jeffrey M and Hartman Sara M
Home Financials for this Owner
Home Financials are based on the most recent Mortgage that was taken out on this home.
Original Mortgage
$146,790
Interest Rate
5.37%
Mortgage Type
Assumption
Create a Home Valuation Report for This Property
The Home Valuation Report is an in-depth analysis detailing your home's value as well as a comparison with similar homes in the area
Home Values in the Area
Average Home Value in this Area
Purchase History
| Date | Buyer | Sale Price | Title Company |
|---|---|---|---|
| Beam Alan C | $209,500 | None Available | |
| Hartman Jeffrey M | -- | None Available | |
| Hartman Jeffrey M | $183,500 | None Available |
Source: Public Records
Mortgage History
| Date | Status | Borrower | Loan Amount |
|---|---|---|---|
| Open | Beam Alan C | $198,000 | |
| Previous Owner | Hartman Jeffrey M | $146,790 |
Source: Public Records
Tax History Compared to Growth
Tax History
| Year | Tax Paid | Tax Assessment Tax Assessment Total Assessment is a certain percentage of the fair market value that is determined by local assessors to be the total taxable value of land and additions on the property. | Land | Improvement |
|---|---|---|---|---|
| 2025 | $3,394 | $383,545 | $19,484 | $364,061 |
| 2024 | $2,657 | $242,027 | $15,222 | $226,805 |
| 2023 | $2,596 | $242,027 | $15,222 | $226,805 |
| 2022 | $2,572 | $242,027 | $15,222 | $226,805 |
| 2021 | $2,584 | $242,027 | $15,222 | $226,805 |
| 2020 | $2,118 | $188,869 | $15,222 | $173,647 |
| 2019 | $2,118 | $188,869 | $15,222 | $173,647 |
| 2018 | $2,098 | $188,869 | $15,222 | $173,647 |
| 2017 | $2,069 | $188,869 | $15,222 | $173,647 |
| 2016 | $2,002 | $188,869 | $15,222 | $173,647 |
| 2015 | $2,008 | $191,280 | $15,222 | $176,058 |
| 2014 | $2,008 | $191,280 | $15,222 | $176,058 |
Source: Public Records
Map
Nearby Homes
- 129 Creekside Dr
- 300 Hidden Creek Dr
- 0 W College Ave
- 339 W College Ave
- 230 Poston Cir
- 2918 Lon St
- 109 Landon Ct
- 00 Rockford Rd
- 322 S Main St
- 00 N Main St
- 116 Fairview St
- 231 Pineland Ave Unit 1
- 125 Flint Hill Church Rd
- 245 E College Ave
- 301 Oak Ave
- 125 Woodhill Dr
- 1622 Patrick Ave
- 1815 Gaffney Rd
- 00 Cliffside Rd
- 133 Brookview Dr
- 135 Creekside Dr
- 137 Creekside Dr
- 133 Creekside Dr
- 134 Creekside Dr
- 136 Creekside Dr
- 130 Creekside Dr
- 317 Hidden Creek Dr
- 314 Hidden Creek Dr
- 309 Hidden Creek Dr
- 126 Creekside Dr
- 312 Hidden Creek Dr
- 127 Creekside Dr
- 307 Hidden Creek Dr
- 310 Hidden Creek Dr
- 124 Creekside Dr
- 125 Creekside Dr
- 123 Creekside Dr
- 308 Hidden Creek Dr
- 305 Hidden Creek Dr
- 122 Creekside Dr