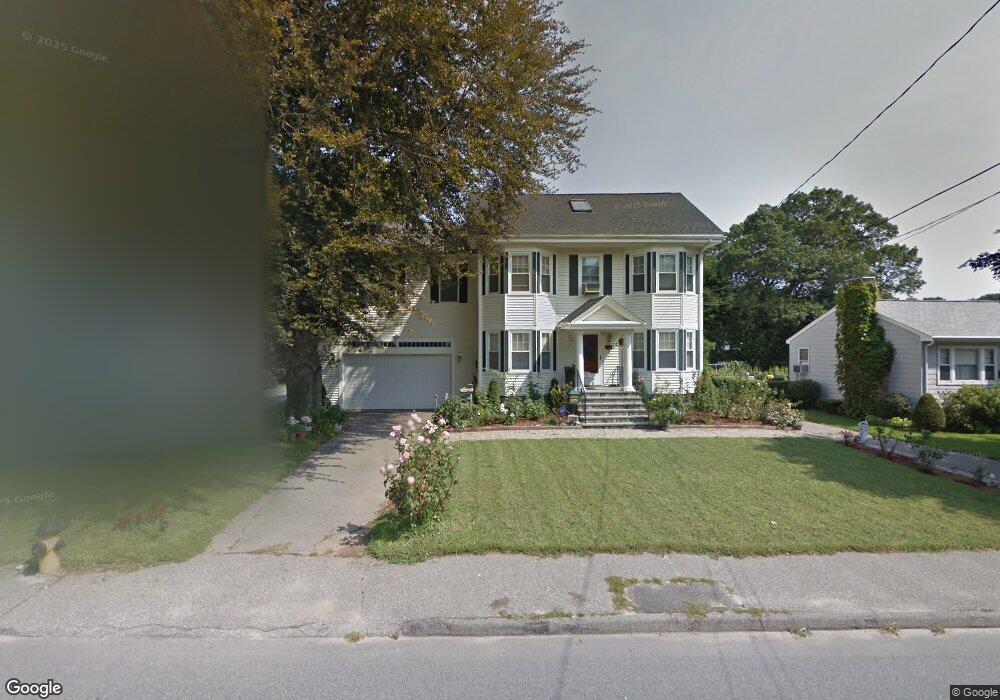
135 Dale St Waltham, MA 02451
Highlands NeighborhoodEstimated Value: $982,000 - $1,040,000
4
Beds
3
Baths
2,762
Sq Ft
$364/Sq Ft
Est. Value
About This Home
This home is located at 135 Dale St, Waltham, MA 02451 and is currently estimated at $1,004,123, approximately $363 per square foot. 135 Dale St is a home located in Middlesex County with nearby schools including Thomas R Plympton Elementary School, John F Kennedy Middle School, and Waltham Sr High School.
Ownership History
Date
Name
Owned For
Owner Type
Purchase Details
Closed on
Mar 31, 1999
Sold by
Courtney Bruce A and Courtney Mary L
Bought by
Pham Lisa H
Current Estimated Value
Home Financials for this Owner
Home Financials are based on the most recent Mortgage that was taken out on this home.
Original Mortgage
$225,000
Outstanding Balance
$55,743
Interest Rate
6.78%
Mortgage Type
Purchase Money Mortgage
Estimated Equity
$948,380
Create a Home Valuation Report for This Property
The Home Valuation Report is an in-depth analysis detailing your home's value as well as a comparison with similar homes in the area
Home Values in the Area
Average Home Value in this Area
Purchase History
| Date | Buyer | Sale Price | Title Company |
|---|---|---|---|
| Pham Lisa H | $284,000 | -- |
Source: Public Records
Mortgage History
| Date | Status | Borrower | Loan Amount |
|---|---|---|---|
| Open | Pham Lisa H | $20,000 | |
| Open | Pham Lisa H | $225,000 | |
| Previous Owner | Pham Lisa H | $100,000 |
Source: Public Records
Tax History Compared to Growth
Tax History
| Year | Tax Paid | Tax Assessment Tax Assessment Total Assessment is a certain percentage of the fair market value that is determined by local assessors to be the total taxable value of land and additions on the property. | Land | Improvement |
|---|---|---|---|---|
| 2025 | $8,003 | $815,000 | $439,600 | $375,400 |
| 2024 | $7,812 | $810,400 | $439,600 | $370,800 |
| 2023 | $7,580 | $734,500 | $398,900 | $335,600 |
| 2022 | $7,849 | $704,600 | $374,400 | $330,200 |
| 2021 | $7,383 | $652,200 | $341,900 | $310,300 |
| 2020 | $7,256 | $607,200 | $309,500 | $297,700 |
| 2019 | $6,774 | $535,100 | $309,500 | $225,600 |
| 2018 | $6,231 | $494,100 | $286,500 | $207,600 |
| 2017 | $5,879 | $468,100 | $260,500 | $207,600 |
| 2016 | $5,629 | $459,900 | $252,300 | $207,600 |
| 2015 | $5,826 | $443,700 | $236,100 | $207,600 |
Source: Public Records
Map
Nearby Homes
- 14 Claremont St
- 326 Bacon St
- 37 Summit St
- 14 Willard St
- 91 Prentice St
- 160 School St Unit 3-1
- 43-45 Welligton Unit 3
- 15 Howard St
- 49 Lincoln St
- 15 Banks St Unit 4
- 16 Winter St Unit 26C
- 214 Church St
- 511 Lexington St
- 32 Harvard St Unit 2
- 70 School St
- 948 Main St Unit 209
- 948 Main St Unit 105
- 39 Floyd St Unit 2
- 7-11.5 Felton
- 79-81 Vernon St
