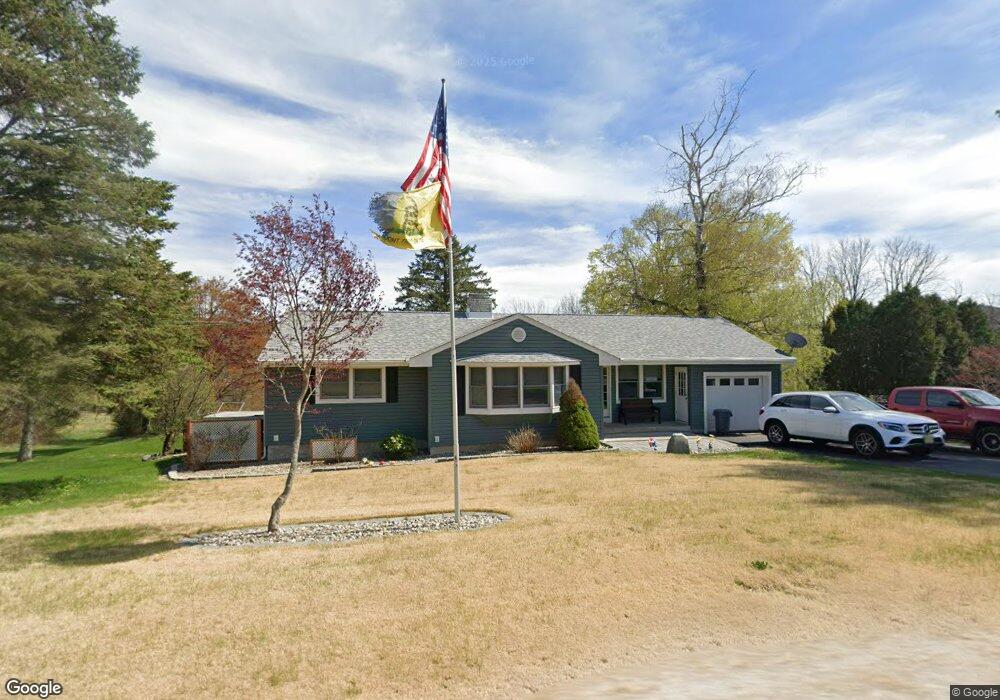
135 Davis Rd Franklin, NJ 07416
Estimated Value: $407,297 - $467,000
Studio
--
Bath
1,168
Sq Ft
$369/Sq Ft
Est. Value
About This Home
This home is located at 135 Davis Rd, Franklin, NJ 07416 and is currently estimated at $431,074, approximately $369 per square foot. 135 Davis Rd is a home located in Sussex County with nearby schools including Franklin Elementary School, Wallkill Valley Regional High School, and Sussex County Technical School.
Ownership History
Date
Name
Owned For
Owner Type
Purchase Details
Closed on
Nov 24, 2003
Sold by
Henderson Roy B and Harios Beverly J
Bought by
Henderson Roy B and Henderson Beverly
Current Estimated Value
Home Financials for this Owner
Home Financials are based on the most recent Mortgage that was taken out on this home.
Original Mortgage
$128,520
Interest Rate
5.88%
Mortgage Type
New Conventional
Purchase Details
Closed on
Apr 30, 1997
Sold by
Gleeson William M and Mccoshen Gleeson Donna
Bought by
Henderson Roy B and Harlos Beverly J
Home Financials for this Owner
Home Financials are based on the most recent Mortgage that was taken out on this home.
Original Mortgage
$135,992
Interest Rate
7.85%
Mortgage Type
FHA
Create a Home Valuation Report for This Property
The Home Valuation Report is an in-depth analysis detailing your home's value as well as a comparison with similar homes in the area
Home Values in the Area
Average Home Value in this Area
Purchase History
| Date | Buyer | Sale Price | Title Company |
|---|---|---|---|
| Henderson Roy B | -- | Chicago Title Insurance Co | |
| Henderson Roy B | $137,500 | -- |
Source: Public Records
Mortgage History
| Date | Status | Borrower | Loan Amount |
|---|---|---|---|
| Closed | Henderson Roy B | $128,520 | |
| Closed | Henderson Roy B | $135,992 |
Source: Public Records
Tax History
| Year | Tax Paid | Tax Assessment Tax Assessment Total Assessment is a certain percentage of the fair market value that is determined by local assessors to be the total taxable value of land and additions on the property. | Land | Improvement |
|---|---|---|---|---|
| 2025 | $9,488 | $386,600 | $129,900 | $256,700 |
| 2024 | $9,415 | $357,500 | $110,700 | $246,800 |
Source: Public Records
Map
Nearby Homes
- 172 Maple Rd
- 149 Maple Rd
- 6 Andre Ct
- 14 Sabine Ln
- 65 Buckwheat Rd
- 26 Wyker Rd Unit A
- 112 Scott Rd
- 52 High St
- 62 High St
- 276 Wild Cat Rd
- 66 Nestor St
- 19 John Wilton St Unit 21
- 35 Liberty Ln Unit Y2
- 63 Liberty Ln Unit 7
- 20 High Point CI
- 109 Munsonhurst Rd
- 111 Munsonhurst Rd
- 113 Munsonhurst Rd
- 11 Zimmer Dr
- 3333 New Jersey 94
Your Personal Tour Guide
Ask me questions while you tour the home.