M
Seller's Agent in 2026
Marcus Case
Berkshire Hathaway HomeServices Elite Real Estate
(801) 234-9014
28 in this area
183 Total Sales
Estimated Value: $467,000 - $570,920
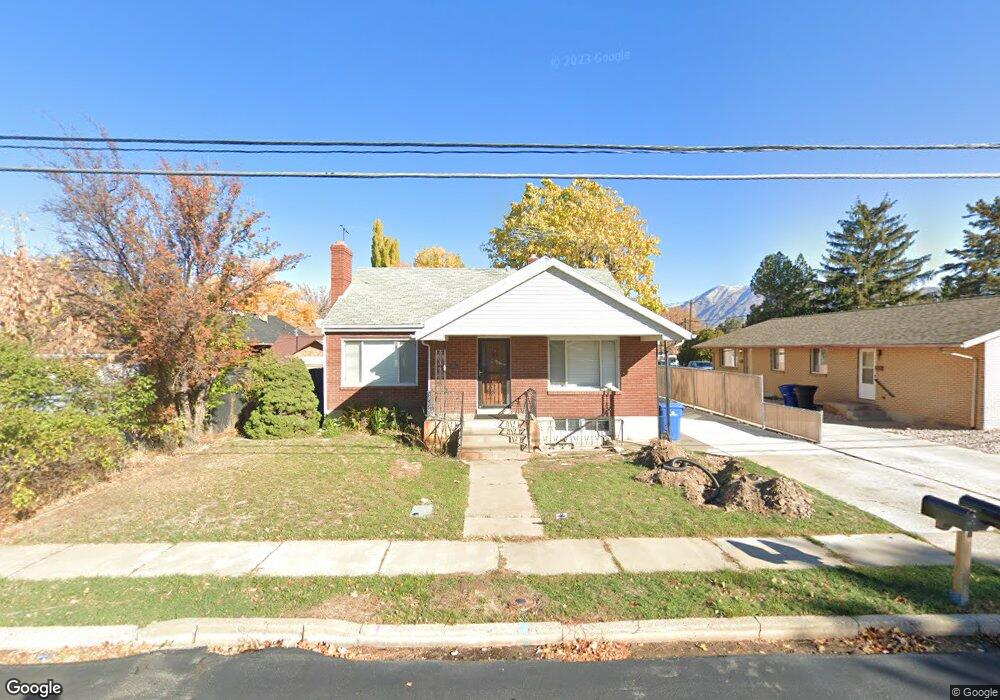
This incredible property is a true income-generating opportunity! Upstairs features 4 spacious bedrooms and 2 full bathrooms. The stylish kitchen boasts quartz countertops and flows seamlessly into a formal dining area. The large living room offers an open, inviting atmosphere-perfect for relaxing or entertaining. Downstairs includes 2 additional bedrooms, one of which is exceptionally large. Both levels have their own fully equipped kitchens and laundry rooms, providing flexible living or rental options. Outside, you'll find a massive 1,500+ sq. ft. shop with full electrical service. Previously used as a woodworking space and for small business operations, it's ideal for a variety of ventures. This property is truly an investor's dream-offering endless possibilities for generating income and maximizing potential! Square footage figures are provided as a courtesy estimate only and were obtained from County records . Buyer is advised to obtain an independent measurement.
| Date | Buyer | Sale Price | Title Company |
|---|---|---|---|
| Sf Taylor House Llc | -- | Pro Title & Escrow | |
| Case Marcus | -- | Inwest Title | |
| Taylor Rodney Lloyd | -- | -- |
| Date | Status | Borrower | Loan Amount |
|---|---|---|---|
| Previous Owner | Case Marcus | $379,500 | |
| Previous Owner | Taylor Rodney Lloyd | $75,712 |
| Date | Event | Price | List to Sale | Price per Sq Ft |
|---|---|---|---|---|
| 02/18/2026 02/18/26 | For Sale | $610,000 | -- | $191 / Sq Ft |
| Year | Tax Paid | Tax Assessment Tax Assessment Total Assessment is a certain percentage of the fair market value that is determined by local assessors to be the total taxable value of land and additions on the property. | Land | Improvement |
|---|---|---|---|---|
| 2025 | $2,294 | $274,890 | -- | -- |
| 2024 | $2,294 | $236,445 | $0 | $0 |
| 2023 | $2,238 | $230,945 | $0 | $0 |
| 2022 | $2,167 | $219,285 | $0 | $0 |
| 2021 | $1,907 | $308,800 | $84,200 | $224,600 |
| 2020 | $819 | $272,500 | $70,200 | $202,300 |
| 2019 | $1,570 | $260,000 | $70,200 | $189,800 |
| 2018 | $679 | $235,200 | $70,200 | $165,000 |
| 2017 | $640 | $118,635 | $0 | $0 |
| 2016 | $524 | $101,255 | $0 | $0 |
| 2015 | $496 | $96,250 | $0 | $0 |
| 2014 | $432 | $87,725 | $0 | $0 |
M
Seller's Agent in 2026
Marcus Case
Berkshire Hathaway HomeServices Elite Real Estate
(801) 234-9014
28 in this area
183 Total Sales
Ask me questions while you tour the home.
