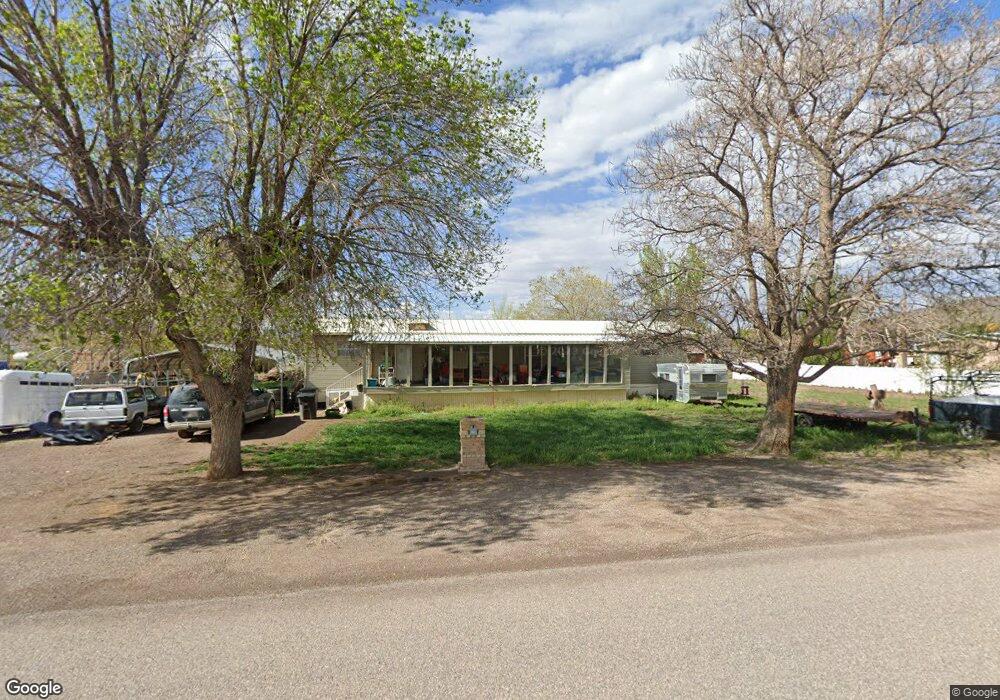
135 E 400 N Monroe, UT 84754
Monroe NeighborhoodEstimated Value: $117,041 - $323,000
Studio
1
Bath
980
Sq Ft
$225/Sq Ft
Est. Value
About This Home
This home is located at 135 E 400 N, Monroe, UT 84754 and is currently estimated at $220,014, approximately $224 per square foot. 135 E 400 N is a home with nearby schools including Monroe School, South Sevier Middle School, and South Sevier High School.
Ownership History
Date
Name
Owned For
Owner Type
Purchase Details
Closed on
Oct 25, 2019
Sold by
Wilson Craig L and Wilson Susan M
Bought by
Wilson Craig L and Wilson Susan M
Current Estimated Value
Purchase Details
Closed on
Aug 13, 2019
Sold by
Wilson Craig L and Wilson Susan M
Bought by
Wilson Craig L and Wilson Susan M
Purchase Details
Closed on
Jun 25, 2019
Sold by
Wilson Craig L and Wilson Susan M
Bought by
Wilson Craig L and Wilson Living Trust
Purchase Details
Closed on
Dec 28, 2018
Sold by
Lundgreen Dana
Bought by
Lundgreen Brent
Purchase Details
Closed on
May 1, 2018
Sold by
Lundgreen Dana
Bought by
Wilson Joshua and Wilson Maria
Create a Home Valuation Report for This Property
The Home Valuation Report is an in-depth analysis detailing your home's value as well as a comparison with similar homes in the area
Home Values in the Area
Average Home Value in this Area
Purchase History
| Date | Buyer | Sale Price | Title Company |
|---|---|---|---|
| Wilson Craig L | -- | None Available | |
| Wilson Craig L | -- | None Available | |
| Wilson Craig L | -- | None Available | |
| Lundgreen Brent | -- | None Available | |
| Wilson Joshua | -- | None Available |
Source: Public Records
Tax History
| Year | Tax Paid | Tax Assessment Tax Assessment Total Assessment is a certain percentage of the fair market value that is determined by local assessors to be the total taxable value of land and additions on the property. | Land | Improvement |
|---|---|---|---|---|
| 2025 | $596 | $66,187 | $35,581 | $30,606 |
| 2024 | $596 | $64,325 | $32,396 | $31,929 |
| 2023 | $589 | $64,216 | $32,984 | $31,232 |
| 2022 | $681 | $64,538 | $26,040 | $38,498 |
| 2021 | $555 | $43,498 | $17,302 | $26,196 |
| 2020 | $529 | $38,859 | $16,478 | $22,381 |
| 2019 | $1,273 | $98,240 | $58,250 | $39,990 |
| 2018 | $1,276 | $87,610 | $51,780 | $35,830 |
| 2017 | $1,250 | $89,180 | $55,660 | $33,520 |
| 2016 | $541 | $53,800 | $0 | $0 |
| 2015 | $541 | $53,800 | $0 | $0 |
| 2014 | $541 | $53,800 | $0 | $0 |
Source: Public Records
Map
Nearby Homes
Your Personal Tour Guide
Ask me questions while you tour the home.