
Seller's Agent in 2026
Kimberly Clingenpeel
Cressy & Everett - South Bend
(574) 339-9310
46 Total Sales
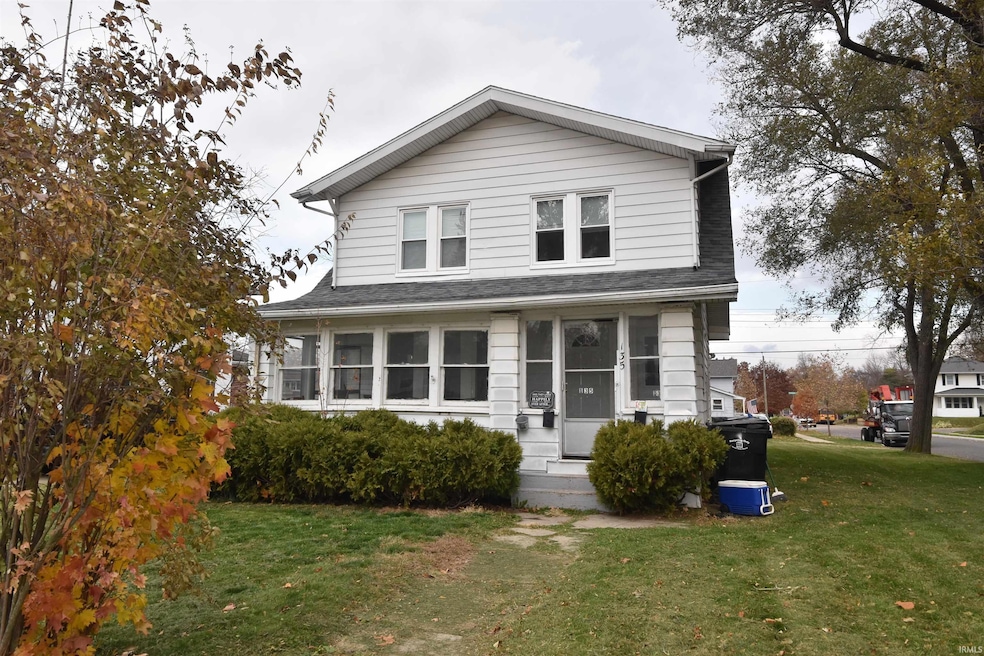
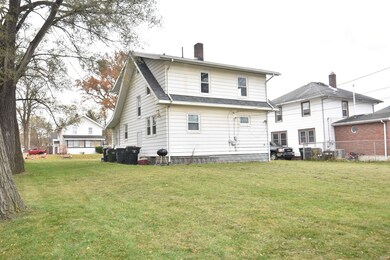
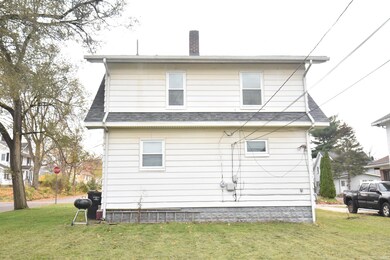
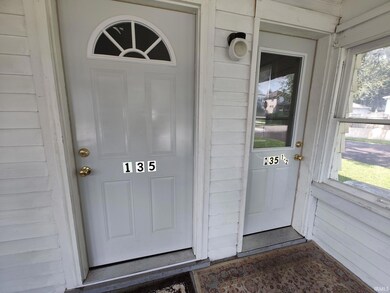
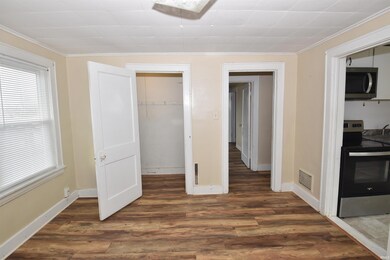
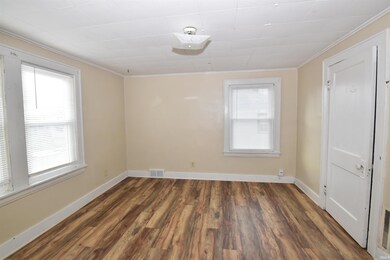
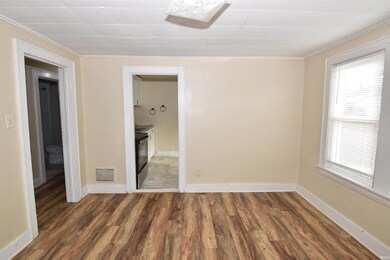
This is a Duplex in South Bend. Each apartment has 1 bedroom, a bathroom and kitchen. It features an enclosed front porch as a common area and entrances to both apartments. The upstairs has had recent updates. The property is being sold AS-IS. Cash and conventional buyers only. The main floor apartment is tenant-occupied. The upper apartment is currently vacant but is seeking a tenant. The property is managed by a local property manager. Cost of Utilities, taxes, misc. expenses are estimated only- not Actual.
Last Agent to Sell the Property
Cressy & Everett - South Bend Brokerage Phone: 574-339-9310 Listed on: 12/05/2025
| Date | Type | Sale Price | Title Company |
|---|---|---|---|
| Warranty Deed | -- | Meridian Title | |
| Warranty Deed | $90,000 | None Available | |
| Warranty Deed | -- | None Listed On Document |
| Date | Event | Price | List to Sale | Price per Sq Ft | Prior Sale |
|---|---|---|---|---|---|
| 01/09/2026 01/09/26 | Sold | $113,000 | -12.4% | $84 / Sq Ft | |
| 12/18/2025 12/18/25 | Pending | -- | -- | -- | |
| 12/05/2025 12/05/25 | For Sale | $129,000 | 0.0% | $96 / Sq Ft | |
| 09/28/2024 09/28/24 | For Rent | $800 | 0.0% | -- | |
| 11/29/2021 11/29/21 | Sold | $90,000 | 0.0% | $67 / Sq Ft | View Prior Sale |
| 11/14/2021 11/14/21 | Pending | -- | -- | -- | |
| 11/03/2021 11/03/21 | For Sale | $90,000 | -- | $67 / Sq Ft |
| Year | Tax Paid | Tax Assessment Tax Assessment Total Assessment is a certain percentage of the fair market value that is determined by local assessors to be the total taxable value of land and additions on the property. | Land | Improvement |
|---|---|---|---|---|
| 2025 | $2,387 | $93,100 | $4,900 | $88,200 |
| 2024 | $2,122 | $97,600 | $4,900 | $92,700 |
| 2023 | $2,036 | $85,400 | $4,800 | $80,600 |
| 2022 | $1,687 | $70,300 | $4,800 | $65,500 |
| 2021 | $1,411 | $67,600 | $7,800 | $59,800 |
| 2020 | $1,387 | $56,000 | $6,400 | $49,600 |
| 2019 | $1,183 | $57,000 | $4,600 | $52,400 |
| 2018 | $1,404 | $57,000 | $4,600 | $52,400 |
| 2017 | $1,454 | $56,600 | $4,600 | $52,000 |
| 2016 | $1,485 | $56,600 | $4,600 | $52,000 |
| 2014 | $1,461 | $55,900 | $4,600 | $51,300 |
Seller's Agent in 2026
Kimberly Clingenpeel
Cressy & Everett - South Bend
(574) 339-9310
46 Total Sales
Buyer's Agent in 2026
Megan Bilderback
Cressy & Everett - South Bend
(260) 585-3174
128 Total Sales
D
Seller's Agent in 2021
Don Szymanski
Realty Plus, Inc.
(574) 360-6890
68 Total Sales
Buyer's Agent in 2021
Carolyn Crooks
Keller Williams Realty Group
(574) 527-2741
218 Total Sales
Source: Indiana Regional MLS
MLS Number: 202548148
APN: 71-08-24-176-017.000-026
Disclaimer: Certain information contained herein is derived from information provided by parties other than Homes.com. All information provided is deemed reliable, but is not guaranteed to be accurate and should be independently verified.
![]() Based on information submitted to the MLS GRID. All data is obtained from various sources and may not have been verified by broker or MLS GRID. Supplied Open House Information is subject to change without notice. All information should be independently reviewed and verified for accuracy. Properties may or may not be listed by the office/agent presenting the information. Some IDX listings have been excluded from this website. IDX information is provided exclusively for personal, non-commercial use, and may not be used for any purpose other than to identify prospective properties consumers may be interested in purchasing. Information is deemed reliable but not guaranteed.
Based on information submitted to the MLS GRID. All data is obtained from various sources and may not have been verified by broker or MLS GRID. Supplied Open House Information is subject to change without notice. All information should be independently reviewed and verified for accuracy. Properties may or may not be listed by the office/agent presenting the information. Some IDX listings have been excluded from this website. IDX information is provided exclusively for personal, non-commercial use, and may not be used for any purpose other than to identify prospective properties consumers may be interested in purchasing. Information is deemed reliable but not guaranteed.
Based on information submitted to the MLS GRID
Ask me questions while you tour the home.