The Signature at MGM Grand Residences 135 E Harmon Ave Unit 3116 Las Vegas, NV 89109
The Strip NeighborhoodEstimated Value: $320,860 - $338,000
--
Bed
1
Bath
520
Sq Ft
$629/Sq Ft
Est. Value
About This Home
This home is located at 135 E Harmon Ave Unit 3116, Las Vegas, NV 89109 and is currently estimated at $326,965, approximately $628 per square foot. 135 E Harmon Ave Unit 3116 is a home located in Clark County with nearby schools including Paradise Elementary School, William E. Orr Middle School, and Del Sol Academy of the Performing Arts.
Ownership History
Date
Name
Owned For
Owner Type
Purchase Details
Closed on
May 4, 2009
Sold by
Us Bank National Association
Bought by
Chan Sabina and Leung Anthony
Current Estimated Value
Purchase Details
Closed on
Jan 29, 2009
Sold by
Park Chung Sook
Bought by
Us Bank National Association
Purchase Details
Closed on
Jan 23, 2007
Sold by
Park Seung
Bought by
Park Chung Sook
Home Financials for this Owner
Home Financials are based on the most recent Mortgage that was taken out on this home.
Original Mortgage
$420,000
Interest Rate
8.5%
Mortgage Type
Unknown
Purchase Details
Closed on
Dec 13, 2006
Sold by
Turnberry/Mgm Grand Tower B Llc
Bought by
Park Chung Sook
Home Financials for this Owner
Home Financials are based on the most recent Mortgage that was taken out on this home.
Original Mortgage
$420,000
Interest Rate
8.5%
Mortgage Type
Unknown
Create a Home Valuation Report for This Property
The Home Valuation Report is an in-depth analysis detailing your home's value as well as a comparison with similar homes in the area
Home Values in the Area
Average Home Value in this Area
Purchase History
| Date | Buyer | Sale Price | Title Company |
|---|---|---|---|
| Chan Sabina | $170,000 | Lsi Title Agency Inc | |
| Us Bank National Association | $422,329 | Fidelity National Default So | |
| Park Chung Sook | -- | Nevada Title Company | |
| Park Chung Sook | $560,000 | Nevada Title Company |
Source: Public Records
Mortgage History
| Date | Status | Borrower | Loan Amount |
|---|---|---|---|
| Previous Owner | Park Chung Sook | $420,000 |
Source: Public Records
Tax History Compared to Growth
Tax History
| Year | Tax Paid | Tax Assessment Tax Assessment Total Assessment is a certain percentage of the fair market value that is determined by local assessors to be the total taxable value of land and additions on the property. | Land | Improvement |
|---|---|---|---|---|
| 2025 | $2,282 | $94,816 | $39,529 | $55,287 |
| 2024 | $2,114 | $94,816 | $39,529 | $55,287 |
| 2023 | $2,114 | $84,328 | $34,580 | $49,748 |
| 2022 | $1,957 | $75,185 | $29,120 | $46,065 |
| 2021 | $1,600 | $73,639 | $29,120 | $44,519 |
| 2020 | $1,680 | $71,698 | $28,210 | $43,488 |
| 2019 | $1,575 | $71,272 | $28,210 | $43,062 |
| 2018 | $1,503 | $63,531 | $20,930 | $42,601 |
| 2017 | $1,874 | $63,887 | $20,020 | $43,867 |
| 2016 | $1,407 | $58,959 | $16,800 | $42,159 |
| 2015 | $1,404 | $54,445 | $14,980 | $39,465 |
| 2014 | $1,360 | $44,993 | $12,250 | $32,743 |
Source: Public Records
About The Signature at MGM Grand Residences
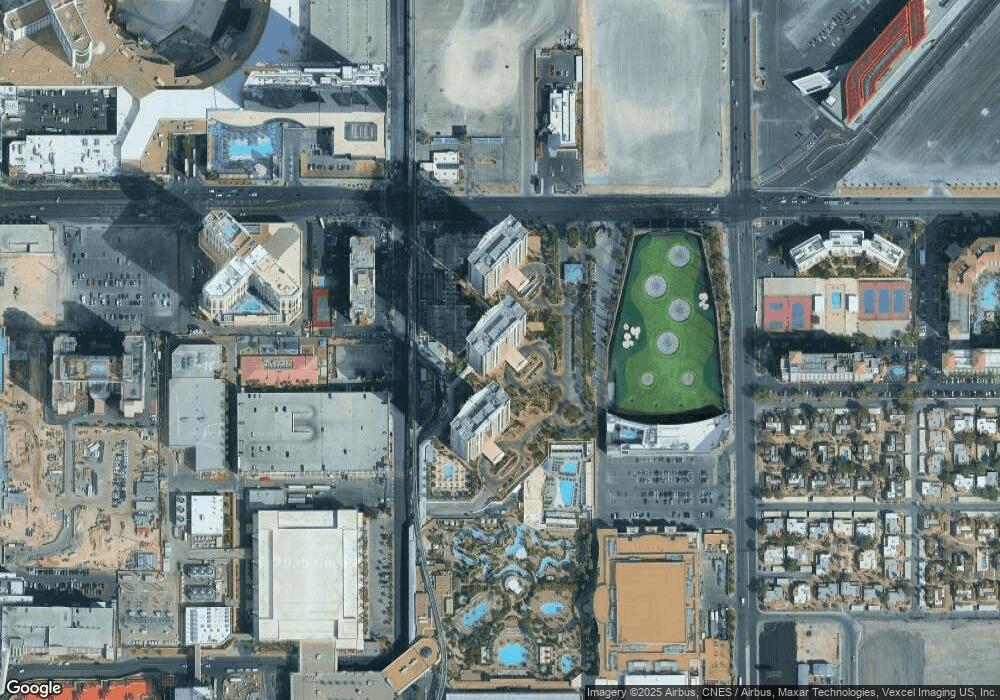
Map
Nearby Homes
- 135 E Harmon Ave Unit 904
- 135 E Harmon Ave Unit 3407
- 135 E Harmon Ave Unit 1621
- 135 E Harmon Ave Unit 307
- 135 E Harmon Ave Unit 2721
- 135 E Harmon Ave Unit 1403
- 135 E Harmon Ave Unit 2303
- 135 E Harmon Ave Unit 3014
- 135 E Harmon Ave Unit 407B
- 135 E Harmon Ave Unit 221
- 135 E Harmon Ave Unit 2411
- 135 E Harmon Ave Unit 3411
- 135 E Harmon Ave Unit 3215
- 135 E Harmon Ave Unit 1020
- 135 E Harmon Ave Unit 2302
- 135 E Harmon Ave Unit 3720
- 135 E Harmon Ave Unit 2916
- 135 E Harmon Ave Unit 3514
- 135 E Harmon Ave Unit 920
- 135 E Harmon Ave Unit 804
- 135 E Harmon Ave Unit 30714
- 135 E Harmon Ave Unit 22717
- 135 E Harmon Ave Unit 3809&3811
- 135 E Harmon Ave Unit 3701,3703
- 135 E Harmon Ave Unit 16714
- 135 E Harmon Ave Unit 702
- 135 E Harmon Ave Unit B1814
- 135 E Harmon Ave
- 135 E Harmon Ave Unit 3211
- 135 E Harmon Ave Unit 3414
- 135 E Harmon Ave Unit 503
- 135 E Harmon Ave Unit 3302
- 135 E Harmon Ave Unit 3202
- 135 E Harmon Ave Unit 3204
- 135 E Harmon Ave Unit 2304
- 135 E Harmon Ave Unit 1711
- 135 E Harmon Ave Unit 3711
- 135 E Harmon Ave Unit 2214
- 135 E Harmon Ave Unit 2517
- 135 E Harmon Ave Unit 2015