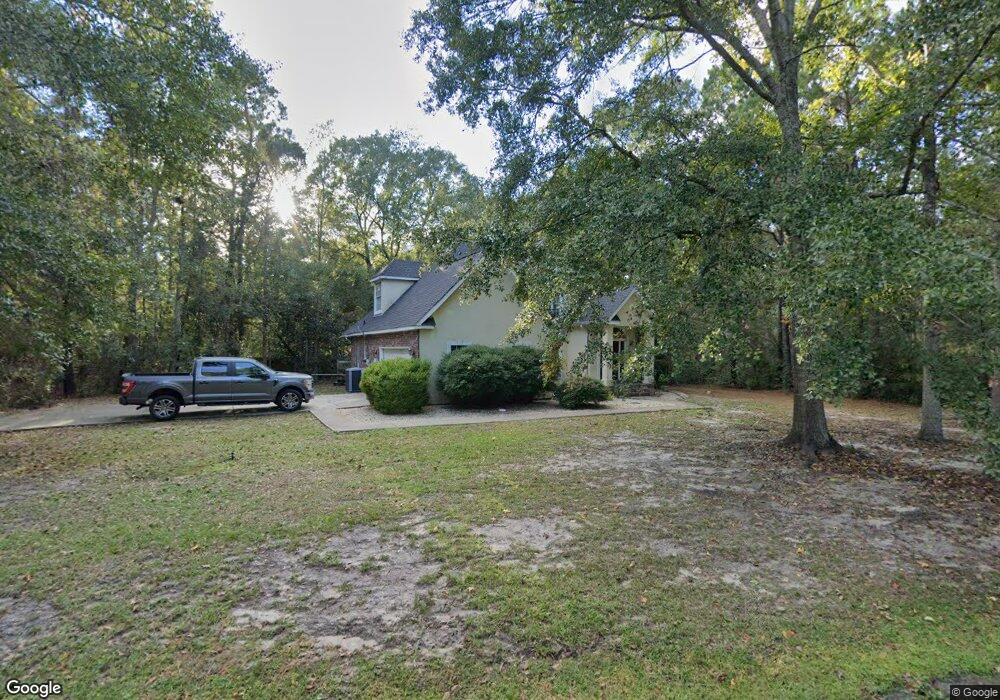
135 Fay Way Slidell, LA 70460
Estimated Value: $254,000 - $317,000
4
Beds
2
Baths
2,117
Sq Ft
$132/Sq Ft
Est. Value
About This Home
This home is located at 135 Fay Way, Slidell, LA 70460 and is currently estimated at $279,177, approximately $131 per square foot. 135 Fay Way is a home located in St. Tammany Parish with nearby schools including Henry Mayfield Elementary School, Slidell Junior High School, and Slidell High School.
Ownership History
Date
Name
Owned For
Owner Type
Purchase Details
Closed on
Jul 30, 2021
Sold by
Berger Michelle Suzanne and Watkins David Chrisrtopher
Bought by
Blanchard Leslie Jane and Blanchard Dwayne Anthony
Current Estimated Value
Home Financials for this Owner
Home Financials are based on the most recent Mortgage that was taken out on this home.
Original Mortgage
$244,999
Outstanding Balance
$222,780
Interest Rate
2.9%
Mortgage Type
VA
Estimated Equity
$56,397
Purchase Details
Closed on
Nov 3, 2014
Sold by
Watkins Michelle S and Watkins David C
Bought by
Blanchard Leslie J and Blanchard Dwayne A
Purchase Details
Closed on
May 20, 2008
Sold by
Sharp Monica Roy
Bought by
Watkins Michelle Berger and Watkins David Christopher
Home Financials for this Owner
Home Financials are based on the most recent Mortgage that was taken out on this home.
Original Mortgage
$248,224
Interest Rate
5.89%
Mortgage Type
VA
Create a Home Valuation Report for This Property
The Home Valuation Report is an in-depth analysis detailing your home's value as well as a comparison with similar homes in the area
Home Values in the Area
Average Home Value in this Area
Purchase History
| Date | Buyer | Sale Price | Title Company |
|---|---|---|---|
| Blanchard Leslie Jane | $245,000 | Team Title Llc | |
| Blanchard Leslie J | $268,000 | Southern Title | |
| Watkins Michelle Berger | $246,000 | Mahony Title Services Llc |
Source: Public Records
Mortgage History
| Date | Status | Borrower | Loan Amount |
|---|---|---|---|
| Open | Blanchard Leslie Jane | $244,999 | |
| Previous Owner | Watkins Michelle Berger | $248,224 |
Source: Public Records
Tax History Compared to Growth
Tax History
| Year | Tax Paid | Tax Assessment Tax Assessment Total Assessment is a certain percentage of the fair market value that is determined by local assessors to be the total taxable value of land and additions on the property. | Land | Improvement |
|---|---|---|---|---|
| 2024 | $3,232 | $25,421 | $2,060 | $23,361 |
| 2023 | $3,364 | $20,782 | $2,060 | $18,722 |
| 2022 | $306,673 | $20,782 | $2,060 | $18,722 |
| 2021 | $3,063 | $20,782 | $2,060 | $18,722 |
| 2020 | $3,047 | $20,782 | $2,060 | $18,722 |
| 2019 | $3,068 | $20,177 | $2,000 | $18,177 |
| 2018 | $3,080 | $20,177 | $2,000 | $18,177 |
| 2017 | $3,100 | $20,177 | $2,000 | $18,177 |
| 2016 | $3,171 | $20,177 | $2,000 | $18,177 |
| 2015 | $3,571 | $22,120 | $2,250 | $19,870 |
| 2014 | $2,329 | $22,120 | $2,250 | $19,870 |
| 2013 | -- | $22,120 | $2,250 | $19,870 |
Source: Public Records
Map
Nearby Homes