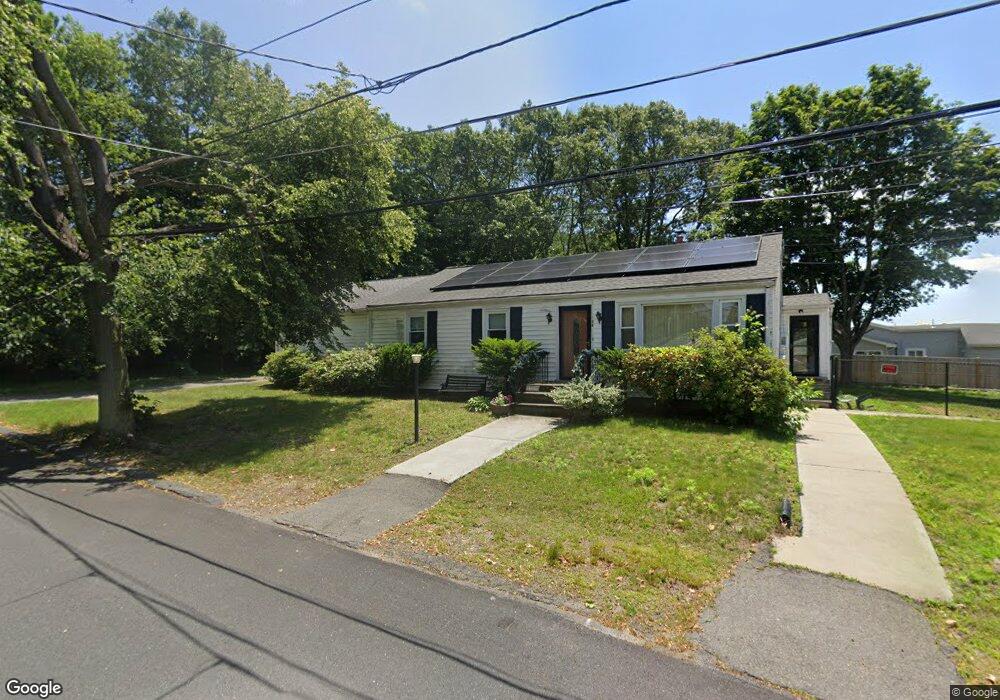
135 Fellsmere St Lynn, MA 01904
Fays Estate NeighborhoodEstimated Value: $628,000 - $733,000
5
Beds
2
Baths
1,720
Sq Ft
$395/Sq Ft
Est. Value
About This Home
This home is located at 135 Fellsmere St, Lynn, MA 01904 and is currently estimated at $680,071, approximately $395 per square foot. 135 Fellsmere St is a home located in Essex County with nearby schools including Aborn Elementary School, William R. Fallon School, and New Paths Area Learning Center.
Ownership History
Date
Name
Owned For
Owner Type
Purchase Details
Closed on
Jun 14, 2011
Sold by
Reynolds Doreen A and Drive Juaneno
Bought by
Civiello Joan M and Civielli Anthony J
Current Estimated Value
Home Financials for this Owner
Home Financials are based on the most recent Mortgage that was taken out on this home.
Original Mortgage
$170,600
Outstanding Balance
$117,754
Interest Rate
4.81%
Mortgage Type
Purchase Money Mortgage
Estimated Equity
$562,317
Purchase Details
Closed on
Sep 25, 2008
Sold by
Jamieson Hugh A and Jamieson Marie D
Bought by
Reynolds Doreen A
Create a Home Valuation Report for This Property
The Home Valuation Report is an in-depth analysis detailing your home's value as well as a comparison with similar homes in the area
Home Values in the Area
Average Home Value in this Area
Purchase History
| Date | Buyer | Sale Price | Title Company |
|---|---|---|---|
| Civiello Joan M | -- | -- | |
| Civiello Joan M | -- | -- | |
| Reynolds Doreen A | -- | -- | |
| Reynolds Doreen A | -- | -- |
Source: Public Records
Mortgage History
| Date | Status | Borrower | Loan Amount |
|---|---|---|---|
| Open | Reynolds Doreen A | $170,600 | |
| Closed | Reynolds Doreen A | $25,000 | |
| Closed | Reynolds Doreen A | $170,600 |
Source: Public Records
Tax History Compared to Growth
Tax History
| Year | Tax Paid | Tax Assessment Tax Assessment Total Assessment is a certain percentage of the fair market value that is determined by local assessors to be the total taxable value of land and additions on the property. | Land | Improvement |
|---|---|---|---|---|
| 2025 | $5,908 | $570,300 | $230,800 | $339,500 |
| 2024 | $5,579 | $529,800 | $221,300 | $308,500 |
| 2023 | $5,402 | $484,500 | $210,300 | $274,200 |
| 2022 | $5,155 | $414,700 | $176,100 | $238,600 |
| 2021 | $4,928 | $378,200 | $160,000 | $218,200 |
| 2020 | $5,025 | $375,000 | $163,600 | $211,400 |
| 2019 | $5,022 | $351,200 | $156,100 | $195,100 |
| 2018 | $4,898 | $323,300 | $152,600 | $170,700 |
| 2017 | $4,611 | $295,600 | $136,100 | $159,500 |
| 2016 | $4,254 | $262,900 | $117,500 | $145,400 |
| 2015 | $4,095 | $244,500 | $116,000 | $128,500 |
Source: Public Records
Map
Nearby Homes
- 22 Burdett Rd
- 112 Fays Ave
- 31 Atkins Ave
- 73 Lockwood Rd
- 31 Spring View Dr
- 39 Kelly Ln
- 57 Kelly Ln
- 53 Kelly Ln
- 605 Eastern Ave Unit 211
- 101 Maple St
- 20 Lexington St
- 15 Magnolia Ave
- 431-433 Chatham St
- 27-29 Graves Ave
- 6A Goodridge St
- 100 Magnolia Ave Unit 5
- 100 Magnolia Ave Unit 4
- 32 Clarendon Ave
- 31 Madison St
- 358 Broadway Unit 13